
Articles
- Page Path
- HOME > Restor Dent Endod > Volume 40(3); 2015 > Article
- Open Lecture on Statistics Statistical notes for clinical researchers: Type I and type II errors in statistical decision
- Hae-Young Kim
-
2015;40(3):-252.
DOI: https://doi.org/10.5395/rde.2015.40.3.249
Published online: June 30, 2015
Department of Health Policy and Management, College of Health Science, and Department of Public Health Sciences, Graduate School, Korea University, Seoul, Korea.
- Correspondence to Hae-Young Kim, DDS, PhD. Associate Professor, Department of Health Policy and Management, College of Health Science, and Department of Public Health Sciences, Graduate School, Korea University, 145 Anam-ro, Seongbukgu, Seoul, Korea 136-701. TEL, +82-2-3290-5667; FAX, +82-2-940-2879; kimhaey@korea.ac.kr
©Copyrights 2015. The Korean Academy of Conservative Dentistry.
This is an Open Access article distributed under the terms of the Creative Commons Attribution Non-Commercial License (http://creativecommons.org/licenses/by-nc/3.0/) which permits unrestricted non-commercial use, distribution, and reproduction in any medium, provided the original work is properly cited.
- 6,491 Views
- 94 Download
- 41 Crossref


Tables & Figures
REFERENCES
Citations
Citations to this article as recorded by 
- Platelet Rich Products in Cleft Palate Repair
Samer T. Elsamna, Fayssal Alqudrah, Mahnoor Khan, Teagen Smith, Jon Robitschek, Julia Toman
The Cleft Palate Craniofacial Journal.2026; 63(6): 1600. CrossRef - Sampling Methods and Sample Size Determination in Clinical Research: An Educational Review
Azzam Zrineh, Maysa Al‐Usta, Abdallah Alwawi
Journal of General and Family Medicine.2026;[Epub] CrossRef - Endorsement of the 32-item Consolidated Criteria for Reporting Qualitative (COREQ) and Standards for Reporting Qualitative Research (SRQR) by Chinese journals of nursing: A survey of editors and review of journal instructions for authors
Li Zhao, Jian Zeng, Kaiyan Hu, Bin Ma, Alejandro Botero Carvajal
PLOS One.2026; 21(4): e0346938. CrossRef - Comments on “Hydrocephalus in pediatric posterior fossa tumors: predictors and outcomes from a single center in Latin America”
Olukorede Olabanji Adekunle
Child's Nervous System.2026;[Epub] CrossRef - Patient-reported BREAST-Q Outcomes of Chest Wall Perforator Flaps in Partial Breast Reconstruction: A Single-center Experience
Onyedi Moses, Dilsan Yilmaz, Jia Shen Chin, Priyadarshini Cooduvalli, Du’a Hashmi, Mohamed Elsehimy, Michael Faheem, Md Zaker Ullah, Shweta Aggarwal
Plastic and Reconstructive Surgery - Global Open.2026; 14(5): e7796. CrossRef - An enabling framework towards digital twins implementation model for sustainable smart facility management
Frank Ato Ghansah, Liupengfei Wu, Caleb Debrah, Kofi Asabere Bediako Asare, Samuel Twum-Ampofo
Smart and Sustainable Built Environment.2026; : 1. CrossRef - Aquatic Compared With Land‐Based Exercises on Gross Motor Function of Children/Adolescents With Cerebral Palsy: A Systematic Review With Meta‐Analysis
Elton Pauluka, Luize Souto Ceolin, Laís Coan Fontanela, Adriana Neves dos Santos
Child: Care, Health and Development.2025;[Epub] CrossRef - The basic statistical concepts and their interrelationships in diagnostic research
Yitao Mao, Juxiong Xiao, Liping Zhu, Yu Zhang, Yueshuang Leng, Qingling Li, Ying Li, Chuyi Liu, Luqing Zhao
Postgraduate Medical Journal.2025; 101(1193): 263. CrossRef - Basic Statistics for Radiologists: Part 1—Basic Data Interpretation and Inferential Statistics
Adarsh Anil Kumar, Jineesh Valakkada, Anoop Ayyappan, Santhosh Kannath
Indian Journal of Radiology and Imaging.2025; 35(S 01): S58. CrossRef - Quantitative Methodology for Assessing the Quality of Direct Laser Processing of 316L Steel Powder Using Type I and Type II Control Errors
Oleksandr Vasilevskyi, Alexandra Woods, Matthew Jones, Michael Cullinan
Electronics.2025; 14(7): 1476. CrossRef - On the effect of flexible adjustment of the p value significance threshold on the reproducibility of randomized clinical trials
Farrokh Habibzadeh, Christine E. King
PLOS One.2025; 20(6): e0325920. CrossRef - Replication, robustness and the angst of false positives: a timely target article and its multifaceted comments
Dan Dediu, Maria Koptjevskaja-Tamm, Kaius Sinnemäki
Linguistic Typology.2025; 29(3): 459. CrossRef - Association between estimated intelligence quotient and treatment outcome in young patients with posttraumatic stress disorder treated with developmentally adapted cognitive processing therapy
Regina Steil, Judith Weiss, Babette Renneberg, Rita Rosner
Cognitive Behaviour Therapy.2025; : 1. CrossRef - Association of climate awareness with urban mobility and consumption behaviour in Accra: a path analysis
Nestor Asiamah, Theophilus Kofi Anyanful, Musah Osumanu Doumbia, Nana Benyi Ansah, Frank Frimpong Opuni, Isaac Aidoo, Faith Muhonja, Simon Mawulorm Agyemang, Cosmos Yarfi, Prince Koranteng Kumi, Kafui Agormeda-Tetteh, Toku Lomatey, Eric Eku
Transportation.2025;[Epub] CrossRef - A quantitative and qualitative assessment of differential privacy’s ability to support collaborative research using a real-world data analysis
David P Gieser, Ashna R Arya, Rebecca Lee Smith, John A Vozenilek, Vishwanath Raman, Jonathan A Handler
JAMIA Open.2025;[Epub] CrossRef - Case study: U.S. airline performance and delay analysis using SAS
Shwadhin Sharma
Journal of Information Technology Teaching Cases.2025;[Epub] CrossRef - Reinterpretation of the results of randomized clinical trials
Farrokh Habibzadeh, Teerapon Dhippayom
PLOS ONE.2024; 19(6): e0305575. CrossRef - Design and validation of a diagnostic suspicion checklist to differentiate epileptic from psychogenic nonepileptic seizures (PNES-DSC)
Pau Sobregrau, Eva Baillès, Joaquim Radua, Mar Carreño, Antonio Donaire, Xavier Setoain, Núria Bargalló, Jordi Rumià, María V. Sánchez Vives, Luis Pintor
Journal of Psychosomatic Research.2024; 180: 111656. CrossRef - CPV Monitoring - Optimization of Control Chart Design by Reducing the False Alarm Rate and Nuisance Signal
Naveenganesh Muralidharan, Thatsinee Johnson, Leyla Rose, Mark Davis
Science Journal of Applied Mathematics and Statistics.2024; 12(2): 20. CrossRef - Risk Factors and Dynamic Nomogram Development for Surgical Site Infection Following Open Wedge High Tibial Osteotomy for Varus Knee Osteoarthritis: A Retrospective Cohort Study
Haichuan Guo, Bixuan Song, Ruijuan Zhou, Jiahao Yu, Pengzhao Chen, Bin Yang, Naihao Pan, Chengsi Li, Yanbin Zhu, Juan Wang
Clinical Interventions in Aging.2023; Volume 18: 2141. CrossRef - Psychiatric and psychological assessment of Spanish patients with drug-resistant epilepsy and psychogenic nonepileptic seizures (PNES) with no response to previous treatments
Pau Sobregrau, Eva Baillès, Mar Carreño, Antonio Donaire, Teresa Boget, Xavier Setoain, Núria Bargalló, Jordi Rumià, María V Sánchez Vives, Luís Pintor
Epilepsy & Behavior.2023; 145: 109329. CrossRef - Cold Water Immersion Directly and Mediated by Alleviated Pain to Promote Quality of Life in Indonesian with Gout Arthritis: A Community-based Randomized Controlled Trial
Maria Dyah Kurniasari, Karen A. Monsen, Shuen Fu Weng, Chyn Yng Yang, Hsiu Ting Tsai
Biological Research For Nursing.2022; 24(2): 245. CrossRef - The impact of COVID-19 infection on hip fracture 30-day mortality
Ahmed Fadulelmola, Rob Gregory, Gavin Gordon, Fiona Smith, Andrew Jennings
Trauma.2022; 24(2): 109. CrossRef - Adjuvant radiation vs Chemoradiation in HPV+ oropharyngeal squamous cell carcinoma with extranodal extension
Samer T. Elsamna, Ghayoour S. Mir, Ibraheem Shaikh, Rohan Shah, Soly Baredes, Richard Chan Woo Park, Dylan F. Roden
Oral Oncology Reports.2022; 1-2: 100003. CrossRef - Improving Student Attitudes and Academic Performance in Introductory Biology Using a Project-Based Learning Community
Tyesha N. Burks
Journal of Microbiology & Biology Education.2022;[Epub] CrossRef - Algorithm for sample availability prediction in a hospital-based epidemiological study spreadsheet-based sample availability calculator
Amrit Sudershan, Kanak Mahajan, Rakesh K. Panjaliya, Manoj K. Dhar, Parvinder Kumar
Scientific Reports.2022;[Epub] CrossRef - Psychiatric and Psychosocial Characteristics of a Cohort of Spanish Individuals Attending Genetic Counseling Due to Risk for Genetically Conditioned Dementia
Pau Sobregrau, Josep M. Peri, Raquel Sánchez del Valle, Jose L. Molinuevo, Bernardo Barra, Luís Pintor
Journal of Alzheimer's Disease Reports.2022; 6(1): 461. CrossRef - Interactions in the 2×2×2 factorial randomised clinical STEPCARE trial and the potential effects on conclusions: a protocol for a simulation study
Markus Harboe Olsen, Aksel Karl Georg Jensen, Josef Dankiewicz, Markus B. Skrifvars, Matti Reinikainen, Marjaana Tiainen, Manoj Saxena, Anders Aneman, Christian Gluud, Susann Ullén, Niklas Nielsen, Janus Christian Jakobsen
Trials.2022;[Epub] CrossRef - Test Corrections Appear To Benefit Lower-Achieving Students in an Introduction to Biology Major Course: Results of a Single-Site, One-Semester Study
Kyeorda Kemp
Journal of Microbiology & Biology Education.2021;[Epub] CrossRef - The impact of COVID-19 infection on hip fractures 30-day mortality
Ahmed Fadulelmola, Rob Gregory, Gavin Gordon, Fiona Smith, Andrew Jennings
Trauma.2021; 23(4): 295. CrossRef - The effectiveness of the role of advanced nurse practitioners compared to physician-led or usual care: A systematic review
Maung Htay, Dean Whitehead
International Journal of Nursing Studies Advances.2021; 3: 100034. CrossRef - p-Hacking as a Questionable Research Practice in Industrial and Organizational Psychology
Bogdan Cocoș
Studia Doctoralia.2021; 12(1): 1. CrossRef - Gene–environment interaction: Oxytocin receptor (OXTR) polymorphisms and parenting style as potential predictors for depressive symptoms
Rebecka Keijser, Cecilia Åslund, Kent W. Nilsson, Susanne Olofsdotter
Psychiatry Research.2021; 303: 114057. CrossRef - Heart Failure Development in Obesity: Underlying Risk Factors and Mechanistic Pathways
Shabbar Jamaly, Lena Carlsson, Markku Peltonen, Johanna C. Andersson-Assarsson, Kristjan Karason
ESC Heart Failure.2021; 8(1): 356. CrossRef - Mapping social reward and punishment processing in the human brain: A voxel-based meta-analysis of neuroimaging findings using the social incentive delay task
D. Martins, L. Rademacher, A.S. Gabay, R. Taylor, J.A. Richey, D.V. Smith, K.S. Goerlich, L. Nawijn, H.R. Cremers, R. Wilson, S. Bhattacharyya, Y. Paloyelis
Neuroscience & Biobehavioral Reviews.2021; 122: 1. CrossRef - Experts’ perceptions on the use of visual analytics for complex mental healthcare planning: an exploratory study
Erin I. Walsh, Younjin Chung, Nicolas Cherbuin, Luis Salvador-Carulla
BMC Medical Research Methodology.2020;[Epub] CrossRef - Flexible Data Trimming Improves Performance of Global Machine Learning Methods in Omics-Based Personalized Oncology
Victor Tkachev, Maxim Sorokin, Constantin Borisov, Andrew Garazha, Anton Buzdin, Nicolas Borisov
International Journal of Molecular Sciences.2020; 21(3): 713. CrossRef - Phthalates exposure and attention-deficit/hyperactivity disorder in children: a systematic review of epidemiological literature
Sarva Mangala Praveena, Rusheni Munisvaradass, Ruziana Masiran, Ranjith Kumar Rajendran, Chu-Ching Lin, Suresh Kumar
Environmental Science and Pollution Research.2020; 27(36): 44757. CrossRef - ThicknessTool: automated ImageJ retinal layer thickness and profile in digital images
Daniel E. Maidana, Shoji Notomi, Takashi Ueta, Tianna Zhou, Danica Joseph, Cassandra Kosmidou, Josep Maria Caminal-Mitjana, Joan W. Miller, Demetrios G. Vavvas
Scientific Reports.2020;[Epub] CrossRef - Predictors of Flu Vaccination for Persons Living With HIV in Central Texas
Julie A. Zuñiga, Alexandra A. García, Jonathan Fordyce, Ya-Ching Huang, Jungmin Park, Jane D. Champion
Journal of the Association of Nurses in AIDS Care.2019; 30(5): 593. CrossRef - Type I, II, and III statistical errors: A brief overview
Parampreet Kaur, Jill Stoltzfus
International Journal of Academic Medicine.2017; 3(2): 268. CrossRef
 ePub Link
 Cite
CiteStatistical notes for clinical researchers: Type I and type II errors in statistical decision
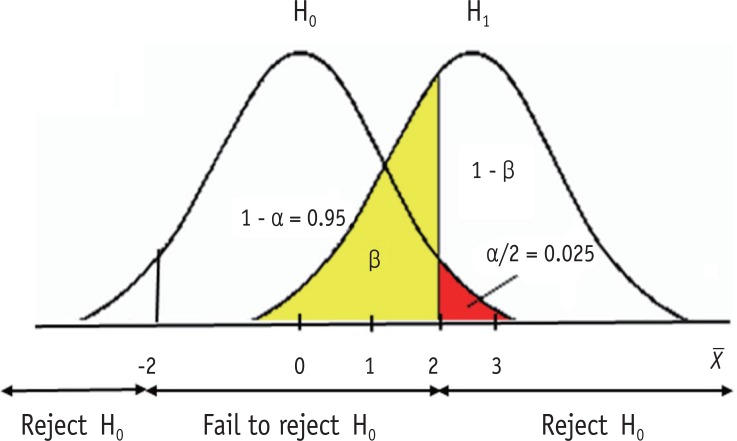
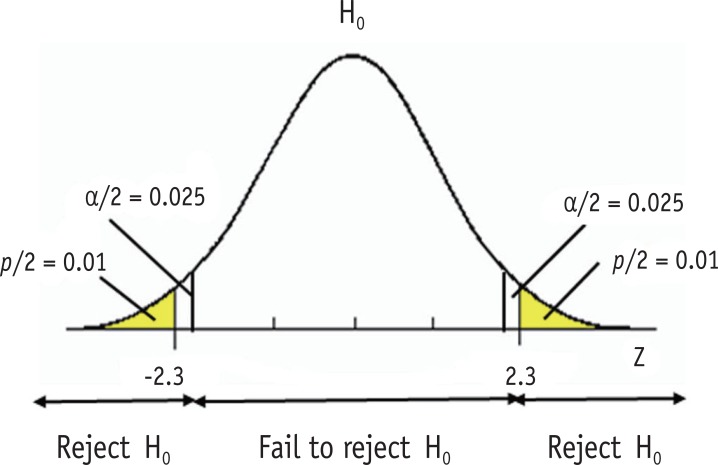
Figure 1 Illustration of type I (α) and type II (β) errors.
Figure 2 Significance level and p value.
Figure 1
Figure 2
Statistical notes for clinical researchers: Type I and type II errors in statistical decision
Possible results of hypothesis testing
| Conclusion based on data | Truth | |
|---|---|---|
| H0 True | H0 False | |
| Reject H0 | Type I error (α) | Correct conclusion (Power = 1 - β) |
| Fail to reject H0 | Correct conclusion (1 - α) | Type II error (β) |
Table 1 Possible results of hypothesis testing

