Abstract
-
Objectives
This study assessed the reliability of digital color measurements using images of resin composite specimens captured with a cellphone.
-
Materials and Methods
The reference color of cylindrical specimens built-up with the use of resin composite (shades A1, A2, A3, and A4) was measured with a portable spectrophotometer (CIELab). Images of the specimens were obtained individually or pairwise (compared shades in the same photograph) under standardized parameters. The color of the specimens was measured in the images using RGB system and converted to CIELab system using image processing software. Whiteness index (WID) and color differences (ΔE00) were calculated for each color measurement method. For the cellphone, the ΔE00 was calculated between the pairs of shades in separate images and in the same image. Data were analyzed using 2-way repeated-measures analysis of variance (α = 0.05). Linear regression models were used to predict the reference ΔE00 values of those calculated using color measured in the images.
-
Results
Images captured with the cellphone resulted in different WID values from the spectrophotometer only for shades A3 and A4. No difference to the reference ΔE00 was observed when individual images were used. In general, a similar ranking of ΔE00 among resin composite shades was observed for all methods. Stronger correlation coefficients with the reference ΔE00 were observed using individual than pairwise images.
-
Conclusions
This study showed that the use of cellphone images to measure the color difference seems to be a feasible alternative providing outcomes similar to those obtained with the spectrophotometer.
-
Keywords: Color; Composite resins; Dental esthetic; Photography, dental; Spectrophotometry
INTRODUCTION
Contemporary esthetic dentistry relies on a proper color match between the tooth structure and restorative material and achieving significant color improvement with clinical procedures such as tooth bleaching [
1,
2]. Therefore, several laboratories and clinical studies involving color in dentistry require reliable methods for color measurement. Methods based on the color match with shade tabs using color shade guides (
i.e., Vita Classical, Vita-Zahnfabrik, Bad Säckingen, Germany) have been used in some clinical trials [
3,
4,
5]. However, the reliability of these methods depends on the experience, ability, and eye fatigue of the evaluator, and environmental factors such as lighting conditions [
6,
7,
8]. Despite the increasing use of portable spectrophotometers or colorimeters in clinical studies, the use of these devices continues to be uncommon among clinicians [
9,
10,
11,
12,
13].
Furthermore, to reduce biases related to subjective color measurements, the use of spectrophotometers allows color to be determined numerically, in addition to evaluating the direction of some color differences (
i.e., increased yellowness) [
14,
15]. Several different color systems have been developed by the Commission Internationale de L'Eclairage (CIE), and the Lab system is the most frequently used in studies involving color measurement in dentistry [
16,
17]. This system is based on the lightness (coordinate L*) and the chromaticity coordinates a* (red-green axis) and b* (yellow-blue axis). The overall color difference between the 2 surfaces is determined by calculating the ΔE
ab, which considers the changes in all color coordinates [
18]. Moreover, the whiteness of some tooth or restorative material can be determined using the Lab coordinates to calculate the whiteness index (WI
D) [
19]. The Lab coordinates can also be converted to other color systems such as CIE Lch (lightness, chroma, and hue), CIE XYZ, and RGB (red-green-blue), for instance, allowing the yellowness index
15 and ΔE
00 to be calculated [
18,
20]. However, despite the several advantages, the use of spectrophotometers has some drawbacks, such as their high cost [
16]. Another inconvenience is that the color measurement can be limited to areas such as the tip of the device [
21,
22]. Thus, it is not possible to measure specific areas of a specimen or to compare different areas within the specimens, by using the majority of spectrophotometers (
i.e., Easy Shade Compact V4, Vita-Zahnfabrik).
An alternative to assess the color of a limited area on a specific surface is by means of digital color measurement using image processing software [
16]. In fact, the use of digital cameras has increased in dental practice as the quality of images captured has improved. Indeed, several studies have demonstrated the accuracy of color measurement with the use of digital images [
23,
24,
25]. However, proper calibration of the camera is required to obtain accurate color information, demanding that the researcher has some photography skills [
26].
On the other hand, the cameras in most cellphones also can produce high-quality images even when using automatic mode. To the best of our knowledge, no previous study has evaluated the reliability of using images acquired with the use of a cellphone to perform the color measurement in dentistry. Therefore, this study aimed to evaluate the reliability of using color data from photographic images acquired with a cellphone camera to analyze resin composite shade colors. We hypothesized that data obtained from images provided by cellphone would result in similar values of 1) WID and 2) ΔE00 among composite shades when compared with those obtained with a spectrophotometer.
MATERIALS AND METHODS
Study design
This was a laboratory study conducted to evaluate the independent variable ‘method of color measurement’ in 2 levels: digital color measurement using images acquired with a cellphone, and a spectrophotometer as reference.
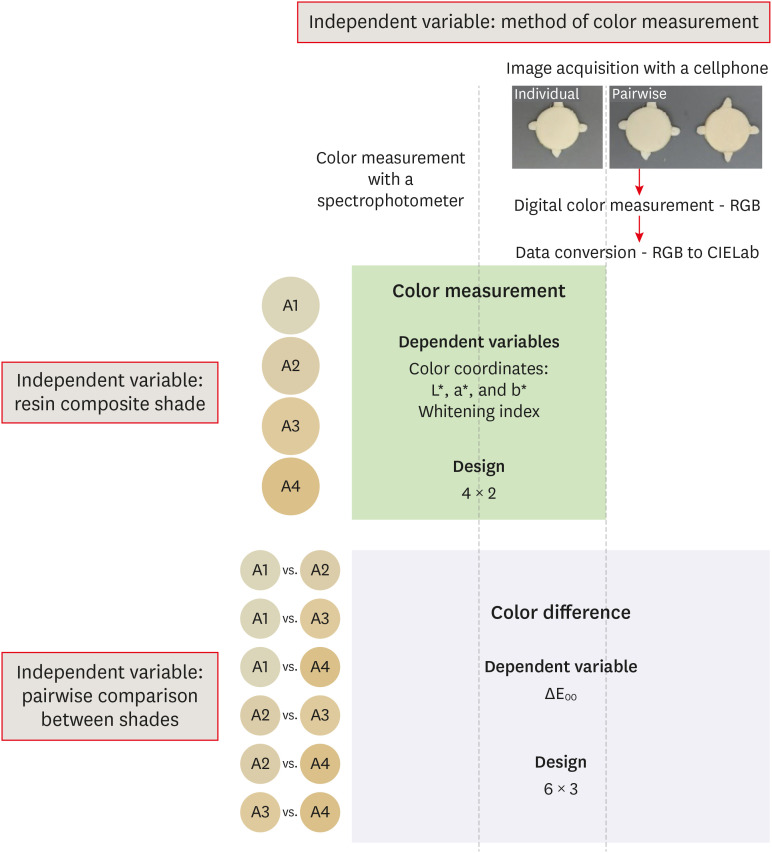
Figure 1 illustrates the experimental design of the study. For the dependent variable WI
D, a 4 × 2 factorial design was used by adding the independent variable “resin composite shade” in 4 levels (A1, A2, A3, and A4) (
n = 3). The color difference between the shades was also assessed by calculating the dependent variable ΔE
00, and 6 × 3 factorial design was used by associating the independent variable “pairwise comparison between shades” in 6 levels with the “method of color measurement” (
n = 9). For this last factor, images of the specimens were obtained individually or pairwise resulting in 3 levels. Sample size calculation was performed for the dependent variable WI
D. The acceptability threshold of 2.6 was used as the minimum detectable difference in means, and the mean standard deviation (0.43) of a previous study in which the optical properties of resin composites were evaluated [
27,
28]. Therefore, 3 specimens per experimental condition were required to have a 95% chance of detecting this difference at a 5% significance level.
Figure 1Schematic illustration of the experimental design of the study.
Specimen preparation
The nanofilled resin composite Z350 XT (3M ESPE, St. Paul, MN, USA) was selected because it is one of the materials most frequently used in dental offices and most often tested in laboratory studies. Therefore, pairwise comparisons of dentin shades resulted in 6 ΔE
00 values. Cylindrical specimens (Ø = 20 mm, h = 1.6 mm) were built-up by inserting a single composite increment into a rubber matrix, sandwiched between polyester strips (n = 3). Composite was light-cured using the LED-based light unit Optilight Max (irradiance ≈ 1,130 mW/cm
2; Gnatus, Barretos, SP, Brazil) with 4 40 seconds photoactivations. The position of the light-curing unit tip (internal Ø ≈ 7.4 mm) was changed between each photoactivation time interval, in order to cover the entire surface of the specimen in overlapping positions [
29]. The light source was positioned approximately 2 mm from the top of the surface. Light-cured specimens were stored in a dry condition for at least 24 hours before performing the color measurements.
The color (used as a reference in the study) and opacity of the specimens were measured with a sphere spectrophotometer (SP60, X-Rite, Grand Rapids, MI, USA), in reflectance mode, using a D65 illuminant and a 2
o observer. D65 illuminant represents average midday light and corresponds to color temperature of approximately 6500 K, while 2° observer represents the field of view established as a standard by the CIE [
30]. These parameters are standardized because they can influence the measurements of color coordinates. Opacity was assessed in triplicate by the difference in the color measurement against white (L = 95.2, a = −1.2, b = 0.3) and black (L = 0.2, a = 0.2, b = −0.4) backgrounds, and was automatically calculated by the spectrophotometer. The color was also measured in triplicate using the CIELab system with the specimens placed against a gray (L = 49.5, a = −0.5, b = −0.3) background (ColorChecker grayscale, X-Rite). For each specimen, the WI
D was calculated using the following formula [
19]:
Images of specimens were acquired using a cellphone (iPhone 8 Plus, Apple, Cupertino, CA, USA). The specimens were placed, either individually or pairwise, against the gray background during the image acquisition procedures. The distance between the cellphone and the specimens was standardized at 10 cm. The images of specimens were exported in .jpg image export format and the specimen colors were measured using the open-source image processing software ImageJ (NIH, Bethesda, MD, USA). A round region of interest of 8 mm in diameter was defined in the center of the specimens, and the color of this area was measured using the plugin ‘RGB measure’. The RGB (red-green-blue) values were converted into CIELab values considering an observer of 2° and illuminant D65.
Calculation of color difference
For all the color measurement methods used, the pairwise color difference among the composite shades was calculated using the following formula [
20]:
where ΔL′, ΔC′, and ΔH′ were the changes in lightness, chroma, and hue, respectively. The SL, SC, and SH were the weighting functions for each component. KL, KC, and KH are the weighting factors for lightness, chroma, and hue, respectively. RT was the interactive term between chroma and hue differences.
Statistical analysis
Normal distribution and equal variance were assessed by Shapiro-Wilk and Levene tests, respectively. The effect of the shade on the composite opacity was analyzed by 1-way analysis of variance (ANOVA). With regard to WID and ΔE00, data were submitted to 2-way repeated-measures ANOVA. All multiple comparisons were performed using the Tukey test. Linear regressions were used to correlate the values of ΔE00 measured using the spectrophotometer data, with those calculated by using images acquired with a cellphone. A confidence level of 5% was pre-set for analyses, which were performed using the SigmaPlot 12.0 statistical software package (Systat Software Inc., Chicago, IL, USA).
RESULTS
Opacity
The results for opacity are presented in
Table 1. One-way ANOVA showed that all the composite specimens had similar opacity, irrespective of the shade tested (
p = 0.542).
Table 1Opacity and WID (n = 3)
|
Resin composite shade |
Opacity*
|
WID
|
|
Spectrophotometer |
Cellphone |
|
A1 |
91.2 ± 1.1 |
34.1 ± 0.4Aa
|
32.6 ± 1.2Aa
|
|
A2 |
90.9 ± 0.8 |
25.1 ± 0.1Ab
|
22.1 ± 1.3Ab
|
|
A3 |
91.3 ± 1.0 |
18.0 ± 0.4Ac
|
12.4 ± 3.4Bc
|
|
A4 |
92.0 ± 0.6 |
10.9 ± 0.5Ad
|
0.3 ± 0.8Ad
|
Color coordinates
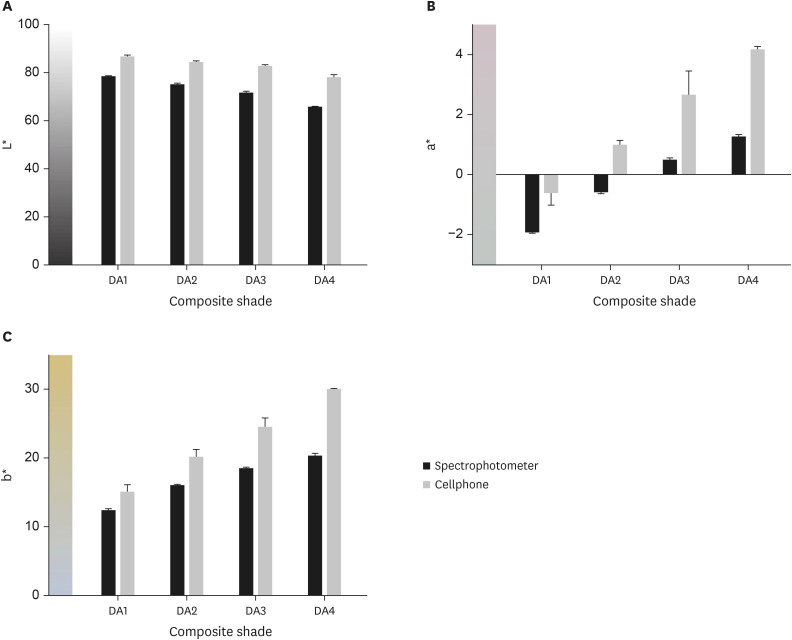
The behaviors of coordinates L*, a*, and b* according to composite shades and devices are described in
Figure 2. In general, cellphone images showed higher values of lightness (
Figure 2A) and chromaticity (coordinate a*,
Figure 2B; coordinate b*,
Figure 2C) than the spectrophotometer. The redness and yellowness increased as the chroma also increased (DA1 to DA4), irrespective of the device used. Otherwise, a slight reduction in lightness was observed toward DA4.
Figure 2The behavior of color coordinates according to composite shade and method of color measurement. (A) Coordinate L* measuring lightness; (B) coordinate a* for red-to-green axis; and (C) coordinate b* for yellow-to-blue axis. Cellphone images presented the highest values for all coordinates.
Whiteness indexes
Table 1 presents the results for WI
D. Two-way ANOVA showed that both ‘composite shade’ (
p < 0.001) and ‘device’ (
p < 0.001) affected the WI
D values, and the interaction between these factors was also significant (
p = 0.002). Irrespective of the method used for color measurement, the whiteness decreased significantly as the chroma increased (from DA1 to DA4), as expected. Images from the cellphone resulted in WI
D values similar to those obtained by the spectrophotometer for whiter shades (DA1 and DA2). However, for the other shades, images obtained from cellphone resulted in lower values of WI
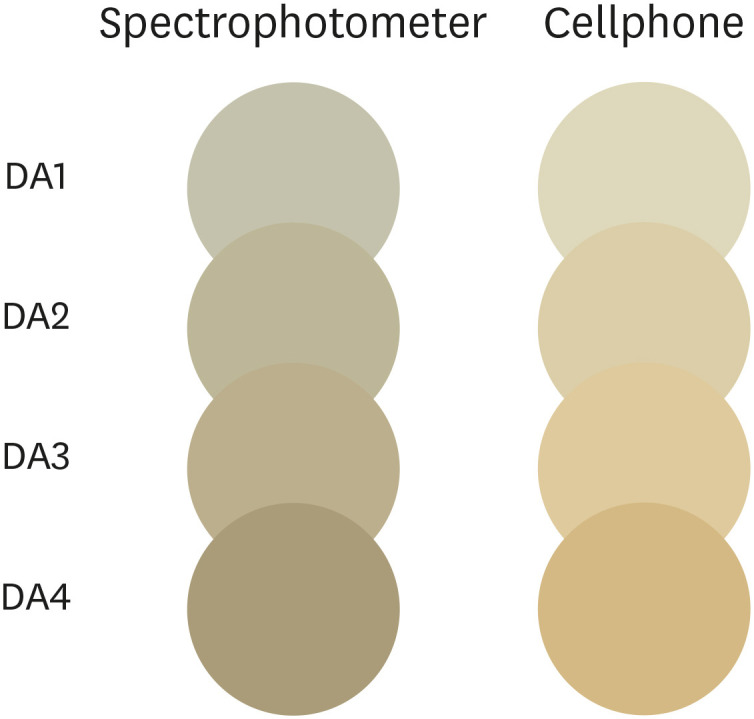
D than those calculated with the use of the spectrophotometer data. An illustrative image was drawn and painted with L*, a*, and b* values using CorelDraw Graphics Suit X8 software (Corel Corporation, Ottawa, ON, Canada) to facilitate viewing the differences in the color readings (
Figure 3).
Figure 3Illustrative cylinder-shaped composite specimens drawn using CorelDraw Graphics Suit X8 software and colored with Lab data obtained with each method of color measurement to simulate differences in color readings. In general, cellphone images appear lighter, redder, and yellower.
Overall color differences
Two-way ANOVA showed that both ‘comparison’ (
p < 0.001) and ‘measurement method’ (
p < 0.001) affected the ΔE
00 values calculated, and the interaction between the factors was also significant (
p < 0.001). The results for ΔE
00 are displayed in
Figure 4. In general, the same behavior was observed for the comparison among the shades within all measurement methods. The highest ΔE
00 values were observed between A1 and A4 (3 levels of chroma change), and the lowest values, for comparison between shades differing a single level of chroma (A1 to A2, A2 to A3, and A3 to A4). Changing 2 levels of chroma (A1 to A3, and A2 to A4) yielded intermediate ΔE
00 values. The ΔE
00 values calculated using individual images obtained from a cellphone were similar to those obtained with the spectrophotometer for all comparisons. In contrast, images of pairwise specimens resulted in 4 (66%) differences in ΔE
00 values from those calculated with the spectrophotometer.
Figure 4The 95% confidence interval (CI) for ∆E00 calculated using a spectrophotometer, or individual and pairwise images obtained from a cellphone (n = 9). CIs for all comparisons using individual images include the mean of the reference (spectrophotometer) of the respective comparison.
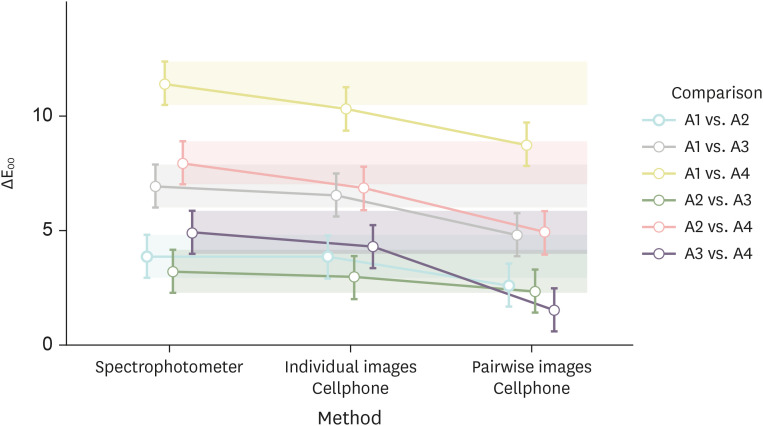
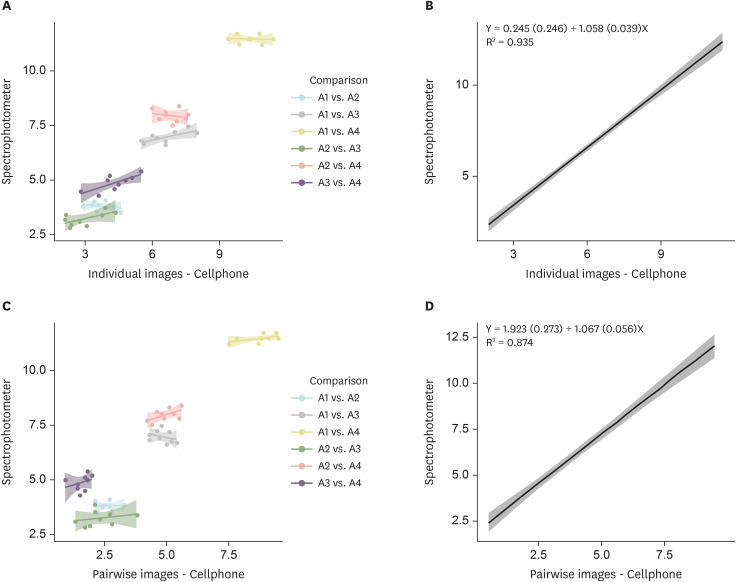
Figure 5 shows the results of linear regressions, defining the ΔE
00 values calculated with the spectrophotometer as the dependent variable. Individual images resulted in a higher coefficient of determination (R
2) values than those obtained with pairwise images, but high coefficients were observed for both methods of image acquisition. Further to the strong correlation, the lowest coefficient (Y
0) values indicated that using individual images obtained with a cellphone resulted in ΔE
00 values close to those obtained with the spectrophotometer.
Figure 5Scatterplots (left) and Linear regressions (right) were used to estimate the ∆E00 calculated using the spectrophotometer data as a function of values of ∆E00 calculated using images obtained with the cellphone. The predictive model improved as a coefficient of determination (R2) increased. (A, B) Individual images (R2 = 0.935); (C, D) pairwise images (R2 = 0.874). Coefficient (standard error).
DISCUSSION
The opaquest shades (dentin) of a resin composite brand were chosen in the present study to reduce any effect of the background on the specimen color measurements [
29]. Hence, the mean opacity of the specimens was higher than 90% for all composite shades, even when using a relatively low thickness of the composite (≈ 1.6 mm). The opacity calculation was based on the difference in specimen colors measured against a white and black background, and it increased as the color difference diminished [
31]. Therefore, the high opacity of the specimens indicated that the measurement of their color was barely affected by the background. Moreover, the color difference calculated among the shades was expected to be close to the real difference.
However, the method of color measurement affected the specimen color and the use of images obtained with a cellphone resulted in higher values than the spectrophotometer for all color coordinates. Moreover, the use of images acquired with a cellphone resulted in the lowest WI
D values when darker shades (A3 and A4) were analyzed. Therefore, the first hypothesis of the study was rejected. WI
D was calculated using data from all color coordinates from the CIElab system. However, the weight and direction of effect in the WI
D calculation differed among the color coordinates [
19]. Although the highest values of lightness (weight of 0.515 in the calculation) tend to increase the WI
D values, the highest values of coordinate a* (weight of 2.324) and b* (weight of 1.1) observed for images from cellphone resulted in a reduction in the WI
D value. Therefore, the differences observed only for shades A3 and A4 were due to higher differences in the coordinates a* and b* (cellphone images were redder and yellower, respectively) in these color shades. However, it is important to emphasize that both methods were able to demonstrate a reduction in WI
D from shade A1 toward A4, in spite of the differences in the WI
D values.
Furthermore, to determine the true specimen colors, the method of color measurement must also be able to indicate the real color difference between different surfaces or areas on the same surface. Thus, images of specimens were acquired in pairs to assess the reliability of the method in determining the color differences between 2 areas located in the same photograph (
i.e., an image of a class IV restoration). Moreover, it is well known that the lighting condition strongly affects the color, and it is difficult to standardize the lighting when 2 images are taken separately [
6,
26]. Thus, the study design also aimed to evaluate possible discrepancies in color difference calculated between 2 specimens when their images were acquired individually or simultaneously in a single photograph. In fact, acquiring the specimen images individually or in pairs resulted in different ΔE
00 values.
Values of ΔE
00 calculated using specimen images obtained individually were similar to those calculated with the spectrophotometer data for all pairwise comparisons among the composite shades. Whereas, using pairwise images of specimens resulted in only 2 (33%) similar ΔE
00 values to those from the spectrophotometer. For other comparisons, pairwise images yielded lower ΔE
00 values than the spectrophotometer. These discrepancies were observed when shades differing by 2 or 3 levels were compared, or for the comparison between the darkest shades (A3 and A4). These discrepancies could be explained due to the tendency to increase the differences in a* and b* values between the data from spectrophotometer and cellphone in shades with high chroma (
Figure 2). Differently from WI
D, similar weights were attributed to all color coordinates in the ΔE
00 calculation, and a change in any coordinate value had a significant effect on its ultimate value [
20].
Linear regressions confirmed that the use of individual specimen images was the most reliable method to obtain ΔE00 values closer to those calculated with the use of the spectrophotometer data. In the linear regressions, the R2 value is the proportion ΔE00 values calculated with data from spectrophotometer (dependent variable = Y) that is predictable from the cellphone data (independent variable = X). For this method, the Y0 indicates the value predicted for the dependent variable when the value of the independent variable is zero, and the Y value increases by adding the X values multiplied by a coefficient “a” related to inclination of the line. For this method, the use of individual cellphone images resulted in a high coefficient of determination (R2 = 0.935), the Y0 close to 0 (Y0 = 0.245) indicated the similarity in ΔE00 values, and the value of coefficient “a” close to 1 (a = 1.058) demonstrated that both variables were changed at a similar rate. The use of pairwise images also resulted in a strong coefficient of determination (R2 = 0.874) and a value of “a” close to 1 (a = 1.067), but the Y0 = 1.923 indicated that using this method tended to overestimate ΔE00 values.
The results of the present study demonstrated that the digital color measurement using images from a cellphone was a reliable and easy way to determine color differences among different composite resin shades. Previous studies have demonstrated the reliability of using images from digital single-lens reflex (DSLR) cameras to measure tooth color [
32,
33,
34]. However, the accuracy of this method relies on prior color calibration, which is a complex procedure that involves obtaining photographs from targets with known colors followed by corrections in the camera parameters (
i.e., whiteness balance) [
32]. Therefore, simpler methods of image acquisition, such as using cellphones in the automatic mode without any special lighting conditions would result in more reproducible and less sensitive methods. Finally, it is important to emphasize that differences among cellphones regarding the systems used to process the captured images, including RGB filters and JPG conversion errors, can affect the color of objects. A single cellphone was used in the present study and differences could be found using other models or devices.
CONCLUSIONS
The findings of the present study demonstrated that the use of images from a cell phone to digitally measure the color difference among resin composite shades yielded reliable results, which were comparable to spectrophotometer tested as a reference.
ACKNOWLEDGEMENT
This study was supported by the Coordination for the Improvement of Higher Educational Personnel -, Brazil (grant CAPES/PROCAD #3001/2014, and Finance Code 001).
-
Conflict of Interest: No potential conflict of interest relevant to this article was reported.
-
Author Contributions:
Conceptualization: de Bragança RMF, Faria-e-Silva AL.
Data curation: de Bragança RMF, Moraes RR, Faria-e-Silva AL.
Formal analysis: de Bragança RMF, Moraes RR, Faria-e-Silva AL.
Funding acquisition: Moraes RR, Faria-e-Silva AL.
Investigation: de Bragança RMF.
Methodology: de Bragança RMF, Moraes RR, Faria-e-Silva AL.
Project administration: Faria-e-Silva AL.
Resources: Faria-e-Silva AL.
Supervision: Faria-e-Silva AL.
Writing - original draft: de Bragança RMF, Moraes RR, Faria-e-Silva AL.
Writing - review & editing: de Bragança RMF, Moraes RR, Faria-e-Silva AL.
REFERENCES
- 1. Trifkovic B, Powers JM, Paravina RD. Color adjustment potential of resin composites. Clin Oral Investig 2018;22:1601-1607.ArticlePubMedPDF
- 2. Westland S, Luo W, Li Y, Pan Q, Joiner A. Investigation of the perceptual thresholds of tooth whiteness. J Dent 2017;67S:S11-S14.ArticlePubMed
- 3. Correa AC, Santana TR, Nahsan FP, Loguercio AD, Faria-E-Silva AL. The impact of a customized tray on in-office bleaching tooth sensitivity: a randomized clinical trial. Oper Dent 2016;41:15-22.ArticlePubMedPDF
- 4. Fernandes MT, Vaez SC, Lima CM, Nahsan FP, Loguércio AD, Faria-E-Silva AL. Preemptive use of naproxen on tooth sensitivity caused by in-office bleaching: a triple-blind, crossover, randomized clinical trial. Oper Dent 2017;42:486-496.ArticlePubMedPDF
- 5. Peixoto AC, Vaez SC, Soares KD, Ferreira LF, Loguercio AD, Faria-E-Silva AL. Preemptive use of piroxicam on tooth sensitivity caused by in-office bleaching: a randomized clinical trial. Braz Dent J 2019;30:498-504.ArticlePubMed
- 6. Gokce HS, Piskin B, Ceyhan D, Gokce SM, Arisan V. Shade matching performance of normal and color vision-deficient dental professionals with standard daylight and tungsten illuminants. J Prosthet Dent 2010;103:139-147.ArticlePubMed
- 7. Imbery TA, Tran D, Baechle MA, Hankle JL, Janus C. Dental shade matching and value discernment abilities of first-year dental students. J Prosthodont 2018;27:821-827.ArticlePubMedPDF
- 8. Corcodel N, Krisam J, Klotz AL, Deisenhofer UK, Stober T, Hassel AJ, Rammelsberg P, Zenthöfer A. Evaluation of small-group education on the shade determination ability of preclinical dental students-a controlled clinical trial. Eur J Dent Educ 2018;22:e582-e587.ArticlePubMedPDF
- 9. Rezende M, Chemin K, Vaez SC, Peixoto AC, Rabelo JF, Braga SSL, Faria-E-Silva AL, Silva GR, Soares CJ, Loguercio AD, Reis A. Effect of topical application of dipyrone on dental sensitivity reduction after in-office dental bleaching: a randomized, triple-blind multicenter clinical trial. J Am Dent Assoc 2018;149:363-371.PubMed
- 10. Klaric Sever E, Budimir Z, Cerovac M, Stambuk M, Par M, Negovetic Vranic D, Tarle Z. Clinical and patient reported outcomes of bleaching effectiveness. Acta Odontol Scand 2018;76:30-38.ArticlePubMed
- 11. Vaez SC, Correia A, Santana TR, Santana M, Peixoto AC, Leal PC, Faria-E-Silva AL. Is a single preliminary session of in-office bleaching beneficial for the effectiveness of at-home tooth bleaching? a randomized controlled clinical trial. Oper Dent 2019;44:E180-E189.ArticlePubMedPDF
- 12. Pereira R, Corado D, Silveira J, Alves R, Mata A, Marques D. Dental prophylaxis influence in tooth color assessment-clinical study. J Esthet Restor Dent 2020;32:586-592.ArticlePubMedPDF
- 13. Wee AG, Meyer A, Wu W, Wichman CS. Lighting conditions used during visual shade matching in private dental offices. J Prosthet Dent 2016;115:469-474.ArticlePubMed
- 14. Igiel C, Lehmann KM, Ghinea R, Weyhrauch M, Hangx Y, Scheller H, Paravina RD. Reliability of visual and instrumental color matching. J Esthet Restor Dent 2017;29:303-308.ArticlePubMedPDF
- 15. Sullivan C, Pan Q, Westland S, Ellwood R. A yellowness index for use in dentistry. J Dent 2019;91:103244.ArticlePubMed
- 16. Chu SJ, Trushkowsky RD, Paravina RD. Dental color matching instruments and systems. Review of clinical and research aspects. J Dent 2010;38(Supplement 2):e2-e16.ArticlePubMed
- 17. Joiner A, Luo W. Tooth colour and whiteness: a review. J Dent 2017;67S:S3-S10.ArticlePubMed
- 18. Gómez-Polo C, Portillo Muñoz M, Lorenzo Luengo MC, Vicente P, Galindo P, Martín Casado AM. Comparison of the CIELab and CIEDE2000 color difference formulas. J Prosthet Dent 2016;115:65-70.ArticlePubMed
- 19. Pérez MM, Ghinea R, Rivas MJ, Yebra A, Ionescu AM, Paravina RD, Herrera LJ. Development of a customized whiteness index for dentistry based on CIELAB color space. Dent Mater 2016;32:461-467.ArticlePubMed
- 20. Luo MR, Cui BR, Rigg B. The development of the CIE 2000 colour‐difference formula: CIEDE2000. Color Res Appl 2001;26:340-350.Article
- 21. Brook AH, Smith RN, Lath DJ. The clinical measurement of tooth colour and stain. Int Dent J 2007;57:324-330.ArticlePubMed
- 22. Bhandari R, Thakur S, Singhal P, Chauhan D, Jayam C, Jain T. In vivo comparative evaluation of esthetics after microabrasion and microabrasion followed by casein phosphopeptide-amorphous calcium fluoride phosphate on molar incisor hypomineralization-affected incisors. Contemp Clin Dent 2019;10:9-15.ArticlePubMedPMC
- 23. Jarad FD, Russell MD, Moss BW. The use of digital imaging for colour matching and communication in restorative dentistry. Br Dent J 2005;199:43-49.ArticlePubMedPDF
- 24. Yamanel K, Caglar A, Özcan M, Gulsah K, Bagis B. Assessment of color parameters of composite resin shade guides using digital imaging versus colorimeter. J Esthet Restor Dent 2010;22:379-388.ArticlePubMed
- 25. Tam WK, Lee HJ. Dental shade matching using a digital camera. J Dent 2012;40(Supplement 2):e3-e10.Article
- 26. Guan YH, Lath DL, Lilley TH, Willmot DR, Marlow I, Brook AH. The measurement of tooth whiteness by image analysis and spectrophotometry: a comparison. J Oral Rehabil 2005;32:7-15.ArticlePubMed
- 27. Pérez MM, Herrera LJ, Carrillo F, Pecho OE, Dudea D, Gasparik C, Ghinea R, Bona AD. Whiteness difference thresholds in dentistry. Dent Mater 2019;35:292-297.ArticlePubMed
- 28. Pecho OE, Ghinea R, do Amaral EA, Cardona JC, Della Bona A, Pérez MM. Relevant optical properties for direct restorative materials. Dent Mater 2016;32:e105-e112.ArticlePubMed
- 29. Santos SMM, Silva PD, Faria-E-Silva AL. Color changes caused by reduction on the dentin shade composite thickness. Braz Dent J 2018;29:469-474.ArticlePubMed
- 30. Dain SJ. Illuminant and observer metamerism and the Hardy-Rand-Rittler color vision test editions. Vis Neurosci 2006;23:685-694.ArticlePubMed
- 31. Spink LS, Rungruanganut P, Megremis S, Kelly JR. Comparison of an absolute and surrogate measure of relative translucency in dental ceramics. Dent Mater 2013;29:702-707.ArticlePubMed
- 32. Tung OH, Lai YL, Ho YC, Chou IC, Lee SY. Development of digital shade guides for color assessment using a digital camera with ring flashes. Clin Oral Investig 2011;15:49-56.ArticlePubMedPDF
- 33. Lazar R, Culic B, Gasparik C, Lazar C, Dudea D. The accuracy of dental shade matching using cross-polarization photography. Int J Comput Dent 2019;22:343-351.PubMed
- 34. Mahn E, Tortora SC, Olate B, Cacciuttolo F, Kernitsky J, Jorquera G. Comparison of visual analog shade matching, a digital visual method with a cross-polarized light filter, and a spectrophotometer for dental color matching. J Prosthet Dent 2021;125:511-516.ArticlePubMed
 , Rafael Ratto Moraes2
 , André Luis Faria-e-Silva3


 KACD
KACD

 ePub Link
 Cite
Cite

