Articles
- Page Path
- HOME > Restor Dent Endod > Volume 27(2); 2002 > Article
- Original Article The effect of irradiation modes on polymerization and microleakage of composite resin
- Jong-Jin Park, Jeong-Won Park, Sung-Ho Park*, Ju-Myong Park, Tae-Kyung Kwon, Sung-Kyo Kim
-
2002;27(2):-174.
DOI: https://doi.org/10.5395/JKACD.2002.27.2.158
Published online: March 31, 2002
Department of Conservative Dentistry, School of Dentistry, Kyungpook National University, Daegu, Korea.
*Department of Conservative Dentistry, College of Dentistry, Yonsei University, Seoul, Korea.
Copyright © 2002 Korean Academy of Conservative Dentistry
- 1,009 Views
- 0 Download
- 2 Crossref
Abstract
-
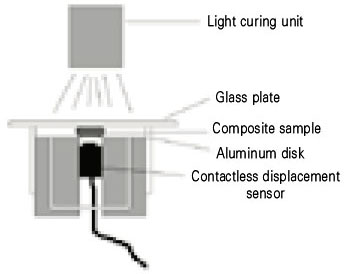
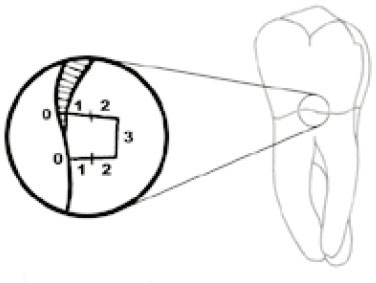
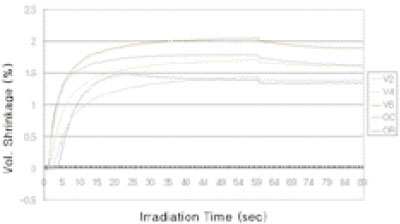
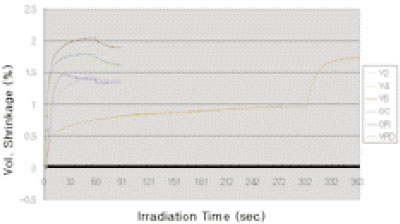
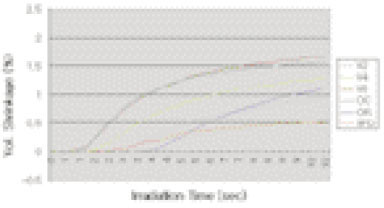
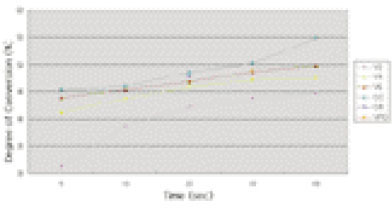
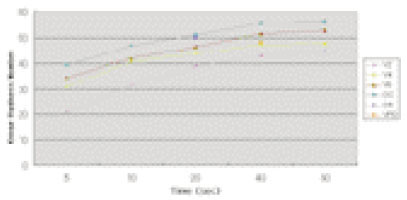
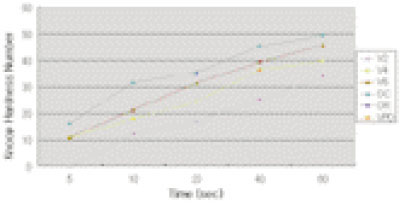
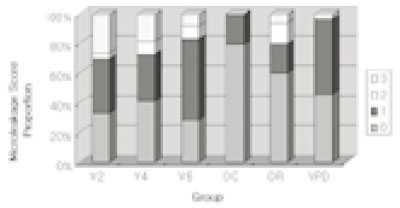
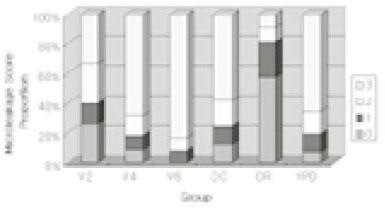
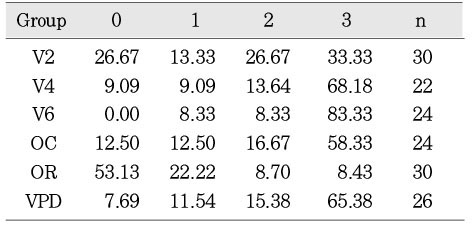
The aim of this study was to investigate the effect of light irradiation modes on polymerization shrinkage, degree of cure and microleakage of a composite resin.VIP™ (Bisco Dental Products, Schaumburg, IL, USA) and Optilux 501™ (Demetron/Kerr, Danbury, CT, USA) were used for curing Filtek™ Z-250 (3M Dental Products, St. Paul., MN, USA) composite resin using following irradiation modes: VIP™ (Bisco) 200mW/cm2 (V2), 400mW/cm2 (V4), 600mW/cm2 (V6), Pulse-delay (200 mW/cm2 3 seconds, 5 minutes wait, 600mW/cm2 30seconds, VPD) and Optilux 501™ (Demetron/Kerr) C-mode (OC), R-mode (OR).Linear polymerization shrinkage of the composite specimens were measured using Linometer (R&B, Daejeon, Korea) for 90 seconds for V2, V4, V6, OC, OR groups and for up to 363 seconds for VPD group (n=10, each).Degree of conversion was measured using FTIR spectrometer (IFS 120 HR, Bruker Karlsruhe, Germany) at the bottom surface of 2 mm thick composite specimens. V2, V4, V6, OC groups were measured separately at five irradiation times (5, 10, 20, 40, 60 seconds) and OR, VPD groups were measured in the above mentioned irradiation modes (n=5, each).Microhardness was measured using Digital microhardness tester (FM7, Future-Tech Co., Tokyo, Japan) at the top and bottom surfaces of 2mm thick composite specimens after exposure to the same irradiation modes as the test of degree of conversion(n=3, each).For the microleakage test, class V cavities were prepared on the distal surface of the ninety extracted human third molars. The cavities were restored with one of the following irradiation modes: V2/60 seconds, V4/40 seconds, V6/30 seconds, VPD, OC and OR. Microleakage was assessed by dye penetration along enamel and dentin margins of cavities.Mean polymerization shrinkage, mean degree of conversion and mean microhardness values for all groups at each time were analyzed using one-way ANOVA and Duncan's multiple range test, and using chi-square test for microleakage values.The results were as follows:·Polymerization shrinkage was increased with higher light intensity in groups using VIP™ (Bisco): the highest with 600mW/cm2, followed by Pulse-delay, 400mW/cm2 and 200mW/cm2 groups. The degree of polymerization shrinkage was higher with Continuous mode than with Ramp mode in groups using Optilux 501™ (Demetron/Kerr).·Degree of conversion and microhardness values were higher with higher light intensity. The final degree of conversion was in the range of 44.7 to 54.98% and the final microhardness value in the range of 34.10 to 56.30.·Microleakage was greater in dentin margin than in enamel margin. Higher light intensity showed more microleakage in dentin margin in groups using VIP™ (Bisco). The micoleakage was the lowest with Continuous mode in enamel margin and with Ramp mode in dentin margin when Optilux 501™(Demetron/Kerr) was used.
- 1. Burke FJ. Light-activated composites : the current status. Dent Update. 1985;12: 182. 184-188.PubMed
- 2. Rueggeverg FA, Caughman WF, Curtis JW Jr. Effect of light intensity and exposure duration on cure of resin composite. Oper Dent. 1994;19: 26-32.PubMed
- 3. Venhoven BA, De Gee AJ, Davidson CL. Polymerization contraction and conversion of light-curing bisGMA-based methacrylate resins. Biomaterials. 1993;14: 871-875.ArticlePubMed
- 4. Feilzer AJ, De Gee AJ, Davidson CL. Curing contraction of composites and glass ionomer cements. J Prosthet Dent. 1988;59: 297-300.ArticlePubMed
- 5. Jensen ME, Chan DCN. In: Vanherle G, Smith DC, editors. Polymerization shrinkage and microleakage. Posterior composite resin dental restorative materials. 1985;ed 1. Utrecht, The Netherlands: szulc; 243.
- 6. Carvalho RM, Pereira JC, Yoshiyama M, Pashley DH. A review of polymerization contraction : The influence of stress development versus stress relief. Oper Dent. 1996;21: 17-24.PubMed
- 7. Suliman AA, Boyer DB, Lakes RS. Cusp movement in premolars resulting from composite polymerization shrinkage. Dent Mater. 1993;9: 6-12.ArticlePubMed
- 8. Hickman J, Jacobsen PH. Finite element analysis of dental polymeric restorations. Clin Mater. 1991;7: 39-46.Article
- 9. Tarumi H, Imazato S, Ehara A, Kato S, Ebi N, Ebisu S. Post-irradiation polymerization of composites containing bis-GMA and TEGDMA. Dent Mater. 1999;15: 238-242.ArticlePubMed
- 10. Miyazaki M, Hinoura K, Onose H, Moore BK. Effect of filler content of light cured composites on bond strength to bovine dentin. J Dent. 1991;19: 301-303.PubMed
- 11. Feilzer AJ, De Gee AJ, Davidson CL. Quantitative determination of stress reduction by flow in composite restorations. Dent Mater. 1990;6: 167-171.ArticlePubMed
- 12. Asmussen E. Clinical relevance of physical, chemical and bonding properties of composite resins. Oper Dent. 1985;10: 61-73.PubMed
- 13. Feilzer AJ, De Gee AJ, Davidson CL. Relaxation of polymerization contraction shear stress by hygroscopic expansion. J Dent Res. 1990;69: 36-39.ArticlePubMedPDF
- 14. Feilzer AJ, De Gee AJ, Davidson CL. Setting stress in composite resin in relation to configuration of the restoration. J Dent Res. 1987;66: 1636-1639.ArticlePubMedPDF
- 15. Reinhardt KJ. Effect of the light source on the marginal adaptation of composite fillings. Dtsch Zahnarztl Z. 1991;46: 132-134.PubMed
- 16. Pilo R, Cardash HS. Post-irradiation polymerization of different anterior and posterior visible lightactivated resin composites. Dent Mater. 1992;8: 299-304.ArticlePubMed
- 17. Kemp-Scholte CM, Davidson CL. Complete marginal seal of class V resin composite restorations effected by increased flexibility. J Dent Res. 1990a;69: 1240-1247.ArticlePubMedPDF
- 18. Davidson CL, Davidson-Kaban SS. Handling of mechanical stresses in composite restorations. Dent Update. 1998;25: 274-283.PubMed
- 19. Dauvillier BS, Feilzer AJ, de Gee AJ, Davidson CL. Visco-elastic parameters of dental restorative materials during setting. J Dent Res. 2000;79: 818-825.ArticlePubMedPDF
- 20. Lutz F, Krejci I, Lodenburg TR. Elimination of polymerization stresses at the margins of posterior composite resin restorations: a new restorative technique. Quintessence Int. 1986;17: 777-784.PubMed
- 21. Lutz JL, Masutani S, Setcos JC, Lutz F, Swartz ML, Phillips RW. Margin quality and microleakage of Class II composite resin restorations. J Am Dent Assoc. 1987;114: 49-57.PubMed
- 22. Winkler MM, Katona TR, Paydar NH. Finite element stress analysis of three filling techniques for class V light-cured composite restorations. J Dent Res. 1996;75: 1477-1484.ArticlePubMedPDF
- 23. Davidson CL, Feilzer AJ. Polymerization shrinkage and polymerization shrinkage stress in polymer-based restoratives. J Dent. 1997;25: 435-440.ArticlePubMed
- 24. Koran P, Kürschner R. Effect of sequential versus continuous irradiation of a light-cured resin composite on shrinkage, viscosity, adhesion, and degree of polymerization. Am J Dent. 1998;11: 17-22.PubMed
- 25. Uno S, Asmussen E. Marginal adaptation of a restorative resin polymerized at reduced rate. Scand J Dent Res. 1991;99: 440-444.ArticlePubMed
- 26. Davidson CL, De Gee AJ. Relaxation of polymerization contraction stresses by flow in dental composites. J Dent Res. 1984;63: 146-148.ArticlePubMedPDF
- 27. Sakaguchi RL, Berge HX. Effect of light intensity on polymerization contraction of posterior composite. J Dent Res. 1997;76(IADR abstract):74. #481.
- 28. Feilzer AJ, Dooren LH, De Gee AJ, Davidson CL. Influence of light intensity on polymerization shrinkage and integrity of restoration-cavity interface. Eur J Oral Sci. 1995;103: 322-326.ArticlePubMed
- 29. Saliha S, Davidson-Kagan , Carel L, Davidson CL, Feilzer AJ, De Gee AJ, Nejdet E. The effect of curing light variations on bulk curing and wall-to-wall quality of two types and various shades of resin composites. Dent Mater. 1997;13: 344-352.ArticlePubMed
- 30. Unterbrink GL, Muessner R. Influence of light intensity on two restorative systems. J Dent. 1995;23: 183-189.ArticlePubMed
- 31. Goracci G, Mori G, De Martinis LC. Curing light intensity and marginal leakage of resin composite restorations. Quinte Inter. 1996;27: 355-362.
- 32. Dennison JB, Yaman P, Seir R, Hamilton JC. Effect of variable light intensity on composite shrinkage. J Prosthet Dent. 2000;84: 499-505.ArticlePubMed
- 33. Mehl A, Hickel R, Kunzelmann KH. Physical properties and gap formation of light-cured composites with and without 'softstart-polymerization'. J Dent. 1997;25: 321-330.ArticlePubMed
- 34. Koran P, Kürschner R. Effect of sequential versus continuous irradiation of a light-cured resin composite on shrinkage, viscosity, adhesion, and degree of polymerization. Am J Dent. 1998;10: 17-22.
- 35. Sakaguchi RL, Berge HX. Reduced light energy density decreases post-gel contraction while maintaining degree of conversion in composites. J Dent. 1998;26: 695-700.ArticlePubMed
- 36. Burgess JO, de Goes M, Walker R, Ripps AH. An evaluation of four light-curing units comparing soft and hard curing. Pract Periodontics Aesthet Dent. 1999;11: 125-132.PubMed
- 37. Ernst CP, Kürschner R, Rippin G, Willershausen B. Stress reduction in resin-based composites cured with a two-step light-curing unit. Am J Dent. 2000;13: 69-72.PubMed
- 38. Suh BI. Reducing the residual strain in composites with the pulse-delay cure technique. APDN. 2000;July-Sep: 4-7.
- 39. Kanca J, Suh BI. Pulse activation : Reducing resin-based composite contraction stresses at the enamel cavosurface margins. Am J Dent. 1999;12: 107-112.PubMed
- 40. Feilzer AJ, De Gee AJ, Davidson CL. Increased wall-to-wall curing contraction in thin bonded resin layers. J Dent Res. 1989;86: 48-50.ArticlePubMedPDF
- 41. Tobolsky AV, Leonard F, Roeser GP. Use of polymerizable ring compounds in constant volume polymerizations. J Polym Sci. 1948;3: 604-611.Article
- 42. Sakaguchi RL, Peters MCRB, Nelson SR, Douglas WH, Poort HW. Effects of polymerization contraction in composite restorations. J Dent. 1992a;20: 178-182.ArticlePubMed
- 43. Olive GH, Olive S. Polymerisation katalisekinetik mechanismen. 1979;Weinheim Bergstraβe: Chemie.
- 44. Harris JS, Jacobsen PH, O'Doherty DM. The effect of curing light intensity and test temperature on the dynamic mechanical properties of two polymer composites. J Oral Rehabil. 1999;26: 635-639.ArticlePubMed
- 45. Althoff O, Hartung M. Advances in light curing. Am J Dent. 2000;13: 77-84.PubMed
- 46. Davidson-Kaban SS, Davidson CL, Feilzer AJ, De Gee AJ, Erdilek N. The effect of curing light variations on bulk curing and wall-to-wall quality of two types and various shades of resin composites. Dent Mater. 1997;13: 344-352.ArticlePubMed
- 47. Bouschlicher MR, Rueggeberg FA, Boyer DB. Effect of stepped light intensity on polymerization force and conversion in a photoactivated composite. J Esthet Dent. 2000;12: 23-29.ArticlePubMed
- 48. Friedl KH, Schmalz G, Hiller KA, Märkl A. Marginal adaptation of class V restorations with and without "softstart-polymerization". Oper Dent. 2000;25: 26-32.PubMed
- 49. Price RB, Bannerman RA, Rizkalla AS, Hall GC. Effect of stepped vs. continuous light curing exposure on bond strengths to dentin. Am J Dent. 2000;13: 123-128.PubMed
- 50. Lai RL, Johnson AE. Measuring polymerization shrinkage of photoactivated restorative materials by a water filled dilatometer. Dent Mater. 1993;9: 139-143.ArticlePubMed
- 51. Rees JS, Jacobsen PH. The polymerization shrinkage of composite resins. Dent Mater. 1989;5: 41-44.ArticlePubMed
- 52. Puckett AD, Smith R. Method to measure the polymerization shrinkage of light cured composites. J Prosthet Dent. 1992;68: 56-58.ArticlePubMed
- 53. Cook WD, Forrest M, Goodwin AA. A simple method for the measurement of polymerization shrinkage in dental composites. Dent Mater. 1999;15: 447-449.ArticlePubMed
- 54. De Gee AJ, Feilzer AJ, Davidson CL. True linear polymerization shrinkage of unfilled resins and composites determined with a linometer. Dent Mater. 1993;9: 11-14.ArticlePubMed
- 55. Silikas N, Eliades G, Watts DC. Light intensity effects on resin composite degree of conversion and shrinkage strain. Dent Mater. 2000;16: 292-296.ArticlePubMed
- 56. Sakaguchi RL, Sasik CT, Bunczak MA, Douglas WH. Strain gauge method for measuring polymerization contraction of composite restoratives. J Dent. 1991;19: 312-316.ArticlePubMed
- 57. Ferracane JL. Correlation between hardness and degree of conversion during the setting reaction of unfilled dental restorative resins. Dent Mater. 1985;1: 11-14.ArticlePubMed
- 58. Ferracane JL, Greener EH. Fourier transform infrared analysis of degree of polymerization in unfilled resins - Methods comparison. J Dent Res. 1984;63(8):1093-1096.ArticlePubMedPDF
- 59. Asmussen E. Factors affecting the quantity of remaining double bonds in restorative resin polymers. Scand J Dent Res. 1982;90: 490-496.ArticlePubMed
- 60. Eliades GC, Vougiouklakis GJ, Caputo AA. Degree of double bond conversion in light-cured composites. Dent Mater. 1987;3: 19-25.ArticlePubMed
- 61. DeWald JP, Ferracane JL. A comparison of four modes of evaluating depth of cure of light-activated composites. J Dent Res. 1987;66(3):727-730.ArticlePubMedPDF
- 62. Sakaguchi RL, Douglas WH, Peters MCRB. Curing light performance and polymerization of composite restorative materials. J Dent. 1992;20: 183-188.ArticlePubMed
- 63. Vankerckhoven H, et al. Unreacted methacrylate groups on the surfaces of composite resins. J Dent Res. 1982;61: 791-798.ArticlePubMedPDF
- 64. Antonucci JM, Toth EE. Extent of polymerization of dental resins by differential scanning calorimetry. J Dent Res. 1983;62: 121-126.ArticlePubMedPDF
- 65. Murray GA, Yates JL, Newman SM. Ultraviolet light and ultraviolet light-activated composite resins. J Prosthet Dent. 1981;46: 167-170.ArticlePubMed
- 66. Cook W. Factors affecting the depth of cure of ultraviolet-polymerized composites. J Dent Res. 1984;59: 800-808.ArticlePubMedPDF
- 67. Venz S, Antonucci JM. Physical and chemical characteristics of dual cured dental composites. J Dent Res. 1988;67: 225-231 (abstract).
- 68. Chan KC, Boyer DB. Curing light-activated composite cement through porcelain. J Dent Res. 1991;68: 476-480.ArticlePubMedPDF
- 69. Asmussen E. Restorative resins : hardness and strength vs. quantity of remaining double bonds. Scand J Dent Res. 1982;90: 484-489.ArticlePubMed
- 70. Rueggeberg FA, Craig RG. Correlation of parameters used to estimate monomer conversion in a light-cured composite. J Dent Res. 1983;67: 932-937.
- 71. Yap AUJ, Wang HB, Siow KS, Gan LM. Polymerization shrinkage of visible-light-cured composites. Oper Dent. 2000;25: 98-103.PubMed
- 72. Lee SH, Chung IY, Rho BD. Influence of low-intensity curing and polishing period on marginal leakage of composite. J Korean Acad Conserv Dent. 2000;25: 85-90.
- 73. Park ES, Kim KO, Kim SK. Effect of light irradiation modes on the marginal leakage of composite resin restoration. J Korean Acad Conserv Dent. 2001;26: 263-272.
- 74. Rueggeberg FA. Precision of hand-held dental radiometers. Quintessence Int. 1993;24: 391-396.PubMed
- 75. Nomoto R, Uchida K, Hirasawa T. Effect of light intensity on polymerization of light cured composite resins. Dent Mater J. 1994;13: 198-205.ArticlePubMed
REFERENCES
Values are mean(standard deviation)*.
*The same superscript letters denote mean values with no statistically significant difference (p>0.01). Duncan grouping was done only within the same time interval.
Thickness of resin specimen was 1.35mm.
n=10 in each group.

Values are mean(standard deviation)*.
*The same superscript letters denote mean values with no statistically significant difference (p>0.01). Duncan grouping was done only within the same time interval.
Thickness of resin specimen was 1.35mm.
n=5 in each group.

Values are mean(standard deviation)*.
*The same superscript letters denote mean values with no statistically significant difference (p>0.01). Duncan grouping was done only within the same time interval.
Thickness of resin specimen was 1.35 mm.
n=3 in each group.

Values are mean(standard deviation)*.
*The same superscript letters denote mean values with no statistically significant difference (p>0.01). Duncan grouping was done only within the same time interval.
Thickness of resin specimen was 1.35 mm.
n=3 in each group.

Tables & Figures
REFERENCES
Citations

- Study on the Effect of Soft-Start Light on Microleakage in Pit and Fissure Closure
Yong Chen, Ling Guo
Journal of Hard Tissue Biology.2023; 32(2): 105. CrossRef - Power density of light curing units through resin inlays fabricated with direct and indirect composites
Hoon-Sang Chang, Young-Jun Lim, Jeong-Mi Kim, Sung-Ok Hong
Journal of Korean Academy of Conservative Dentistry.2010; 35(5): 353. CrossRef


Fig. 1
Fig. 2
Fig. 3
Fig. 4
Fig. 5
Fig. 6
Fig. 7
Fig. 8
Fig. 9
Fig. 10
Various light curing modes used in this study
Linear polymerization shrinkage (10-3mm)
Values are mean(standard deviation)*.
*The same superscript letters denote mean values with no statistically significant difference (p>0.01). Duncan grouping was done only within the same time interval.
Thickness of resin specimen was 1.35mm.
n=10 in each group.
Degree of conversion at the bottom surface of 2 mm-thickness specimens (%)
Values are mean(standard deviation)*.
*The same superscript letters denote mean values with no statistically significant difference (p>0.01). Duncan grouping was done only within the same time interval.
Thickness of resin specimen was 1.35mm.
n=5 in each group.
Knoop Hardness Number at the top surface of 2 mm-thickness specimens
Values are mean(standard deviation)*.
*The same superscript letters denote mean values with no statistically significant difference (p>0.01). Duncan grouping was done only within the same time interval.
Thickness of resin specimen was 1.35 mm.
n=3 in each group.
Knoop Hardness Number at the bottom surface of 2mm-thickness specimens
Values are mean(standard deviation)*.
*The same superscript letters denote mean values with no statistically significant difference (p>0.01). Duncan grouping was done only within the same time interval.
Thickness of resin specimen was 1.35 mm.
n=3 in each group.
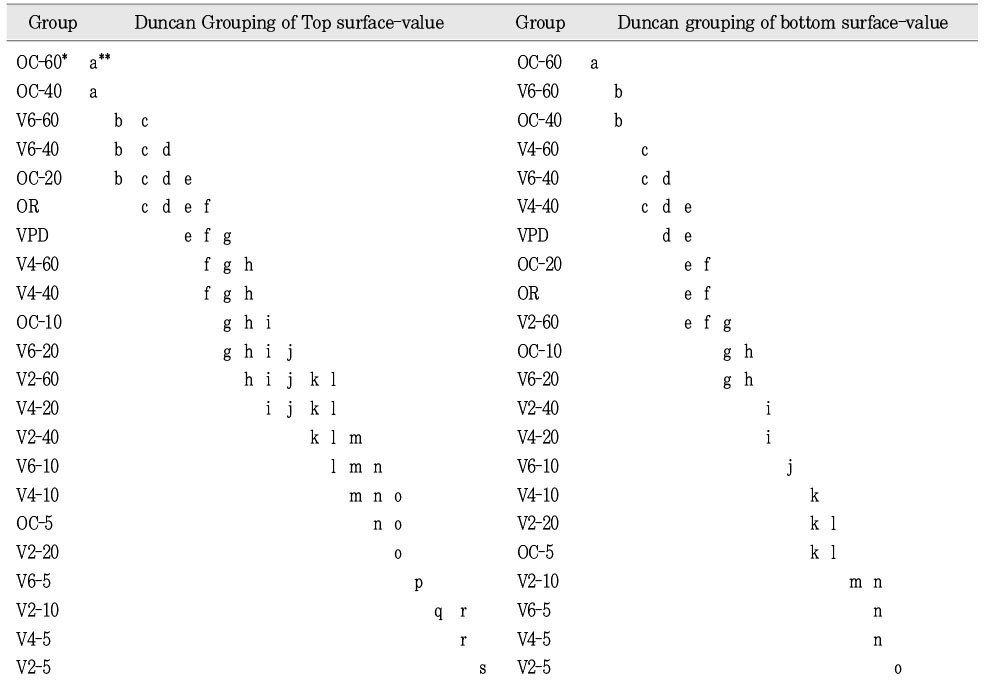
Statistical analysis of microhardness at the top and bottom surfaces
*Experimental groups are expressed as irradiation mode-exposure time.
**The same letters denote no statistically significant difference (p>0.01).
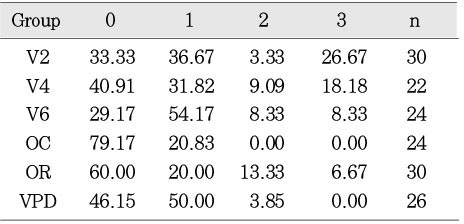
Microleakage score proportions at enamel margin (%)
Microleakage score proportions at dentin margin (%)
Values are mean(standard deviation)*. *The same superscript letters denote mean values with no statistically significant difference (p>0.01). Duncan grouping was done only within the same time interval. Thickness of resin specimen was 1.35mm. n=10 in each group.
Values are mean(standard deviation)*. *The same superscript letters denote mean values with no statistically significant difference (p>0.01). Duncan grouping was done only within the same time interval. Thickness of resin specimen was 1.35mm. n=5 in each group.
Values are mean(standard deviation)*. *The same superscript letters denote mean values with no statistically significant difference (p>0.01). Duncan grouping was done only within the same time interval. Thickness of resin specimen was 1.35 mm. n=3 in each group.
Values are mean(standard deviation)*. *The same superscript letters denote mean values with no statistically significant difference (p>0.01). Duncan grouping was done only within the same time interval. Thickness of resin specimen was 1.35 mm. n=3 in each group.
*Experimental groups are expressed as irradiation mode-exposure time. **The same letters denote no statistically significant difference (p>0.01).

 KACD
KACD

 ePub Link
 Cite
Cite

