
Articles
- Page Path
- HOME > Restor Dent Endod > Volume 40(1); 2015 > Article
- Open Lecture on Statistics Statistical notes for clinical researchers: A one-way repeated measures ANOVA for data with repeated observations
- Hae-Young Kim
-
2015;40(1):-95.
DOI: https://doi.org/10.5395/rde.2015.40.1.91
Published online: January 12, 2015
Department of Dental Laboratory Science and Engineering, College of Health Science & Department of Public Health Science, Graduate School, Korea University, Seoul, Korea.
- Correspondence to Hae-Young Kim, DDS, PhD. Associate Professor, Department of Dental Laboratory Science & Engineering, Korea University College of Health Science, San 1 Jeongneung 3-dong, Seongbuk-gu, Seoul, Korea 136-703. TEL, +82-2-940-2845; FAX, +82-2-909-3502, kimhaey@korea.ac.kr
©Copyrights 2015. The Korean Academy of Conservative Dentistry.
This is an Open Access article distributed under the terms of the Creative Commons Attribution Non-Commercial License (http://creativecommons.org/licenses/by-nc/3.0/) which permits unrestricted non-commercial use, distribution, and reproduction in any medium, provided the original work is properly cited.
- 9,799 Views
- 137 Download
- 31 Crossref
Tables & Figures
REFERENCES
Citations
Citations to this article as recorded by 
- Strength training and detraining in female dancesport athletes: adaptations and retention of lower limb muscle architecture, strength, and dance performance
Jingting Lu, Tze-Huan Lei, Eva Nabiha Binti Zamri, Shazlin Shaharudin
BMC Sports Science, Medicine and Rehabilitation.2026;[Epub] CrossRef - Developing dementia knowledge, attitudes, and confidence through nursing education: A quasi-experimental one-sample panel evaluation of a 3-year sequential dementia education programme
Aoife Conway, Deirdre Harkin, Assumpta Ryan, Paul Slater
Nurse Education Today.2026; 165: 107167. CrossRef - Effects of a Self-Management Program for Temporomandibular Myalgia in Patients With Fibromyalgia: A Single-Arm Study
José Edgar Ferrández-Gómez, Aitor Baño-Alcaraz, Mariano Gacto-Sanchez
Pain Management Nursing.2026;[Epub] CrossRef - The Distorting Influence of Primacy Effects on Reporting Cognitive Load in Learning Materials of Varying Complexity
Felix Krieglstein, Maik Beege, Lukas Wesenberg, Günter Daniel Rey, Sascha Schneider
Educational Psychology Review.2025;[Epub] CrossRef - Systemically circulating 17β-estradiol enhances the neuroprotective effect of the smoking cessation drug cytisine in female parkinsonian mice
Sara M. Zarate, Roger C. Garcia, Gauri Pandey, Rahul Srinivasan
npj Parkinson's Disease.2025;[Epub] CrossRef - Basic Statistics for Radiologists: Part 1—Basic Data Interpretation and Inferential Statistics
Adarsh Anil Kumar, Jineesh Valakkada, Anoop Ayyappan, Santhosh Kannath
Indian Journal of Radiology and Imaging.2025; 35(S 01): S58. CrossRef - How much missing data is too much to impute for longitudinal health indicators? A preliminary guideline for the choice of the extent of missing proportion to impute with multiple imputation by chained equations
K. P. Junaid, Tanvi Kiran, Madhu Gupta, Kamal Kishore, Sujata Siwatch
Population Health Metrics.2025;[Epub] CrossRef - Exploring nightly variability and clinical influences on sleep measures: insights from a digital brain health platform
Huitong Ding, Sanskruti Madan, Edward Searls, Matthew McNulty, Spencer Low, Zexu Li, Kristi Ho, Salman Rahman, Akwaugo Igwe, Zachary Popp, Phillip H. Hwang, Ileana De Anda-Duran, Vijaya B. Kolachalama, Jesse Mez, Michael L. Alosco, Robert J. Thomas, Rhoda
Sleep Medicine.2025; 131: 106532. CrossRef - Proposed Standard Test to Evaluate Back-Support Exoskeleton Efficacy for Rebar Workers: Test Design and Initial Implementation
Malcolm Dunson-Todd, Mazdak Nik-Bakht, Amin Hammad
Journal of Computing in Civil Engineering.2025;[Epub] CrossRef - Analysis of interaction effect between within- and between-subject factors in repeated measures analysis of variance for longitudinal data
Jonghae Kim, Jae Hong Park, Tae Kyun Kim
Korean Journal of Anesthesiology.2025; 78(5): 418. CrossRef - Assessing the Quality of World Health Organisation Guidelines during Health Emergencies: A Domain-Based Analysis
Bernard Ayine, Cornelius Fuumaale Suom-Kogle
Journal of Epidemiology and Global Health.2025;[Epub] CrossRef - Appraising the Factors Associated with Delirium Care Behaviours and Barriers to Their Assessment Among Clinical Nurses: A Cross-Sectional Study
Susan Ka Yee Chow, Soi Chu Chan
International Journal of Environmental Research and Public Health.2024; 21(12): 1582. CrossRef - Partitioning for Enhanced Statistical Power and Noise Reduction: Comparing One-Way and Repeated Measures Analysis of Variance (ANOVA)
Frederick Strale
Cureus.2024;[Epub] CrossRef - Development of a near infrared region based non-invasive therapy device for diabetic peripheral neuropathy
S. V. K. R. Rajeswari, Vijayakumar Ponnusamy, Nemanja Zdravkovic, Emilija Kisic, V. Padmajothi, S. Vijayalakshmi, C. Anuradha, D. Malathi, Nandakumar Ramasamy, Kumar Janardhan, Melvin George
Scientific Reports.2024;[Epub] CrossRef - Influence of membrane pore-size on the recovery of endogenous viruses from wastewater using an adsorption-extraction method
Warish Ahmed, Wendy J.M. Smith, Kwanrawee Sirikanchana, Masaaki Kitajima, Aaron Bivins, Stuart L. Simpson
Journal of Virological Methods.2023; 317: 114732. CrossRef - The effect of objective structured clinical examinations for nursing students
Eun-Ho Ha, Eunju Lim, Atiyeh Abdallah
PLOS ONE.2023; 18(6): e0286787. CrossRef - Myotomy and EndoFLIP: repeated measurements require a different statistical test
Nitin Jagtap, C. Sai Kumar, Rakesh Kalapala, D. Nageshwar Reddy
Gastrointestinal Endoscopy.2022; 95(4): 810. CrossRef - Training History, Cardiac Autonomic Recovery from Submaximal Exercise and Associated Performance in Recreational Runners
Matic Špenko, Ivana Potočnik, Ian Edwards, Nejka Potočnik
International Journal of Environmental Research and Public Health.2022; 19(16): 9797. CrossRef - Real-time vehicular accident prevention system using deep learning architecture
Md Faysal Kabir, Sahadev Roy
Expert Systems with Applications.2022; 206: 117837. CrossRef - Redesigning navigational aids using virtual global landmarks to improve spatial knowledge retrieval
Jia Liu, Avinash Kumar Singh, Anna Wunderlich, Klaus Gramann, Chin-Teng Lin
npj Science of Learning.2022;[Epub] CrossRef - Modeling the Progression of Speech Deficits in Cerebellar Ataxia Using a Mixture Mixed-Effect Machine Learning Framework
Bipasha Kashyap, Pubudu N. Pathirana, Malcolm Horne, Laura Power, David J. Szmulewicz
IEEE Access.2021; 9: 135343. CrossRef - Physiologic Characteristics of Hyperosmolar Therapy After Pediatric Traumatic Brain Injury
Jeffrey Wellard, Michael Kuwabara, P. David Adelson, Brian Appavu
Frontiers in Neurology.2021;[Epub] CrossRef - Effects of Brain Breaks Video Intervention of Decisional Balance among Malaysians with Type 2 Diabetes Mellitus: A Randomised Controlled Trial
Aizuddin Hidrus, Yee Cheng Kueh, Bachok Norsa’adah, Yu-Kai Chang, Garry Kuan
International Journal of Environmental Research and Public Health.2021; 18(17): 8972. CrossRef - Inter-study repeatability of circumferential strain and diastolic strain rate by CMR tagging, feature tracking and tissue tracking in ST-segment elevation myocardial infarction
Sheraz A. Nazir, Abhishek M. Shetye, Jamal N. Khan, Anvesha Singh, Jayanth R. Arnold, Iain Squire, Gerry P. McCann
The International Journal of Cardiovascular Imaging.2020; 36(6): 1133. CrossRef - Coagulation FXIII-A Protein Expression Defines Three Novel Sub-populations in Pediatric B-Cell Progenitor Acute Lymphoblastic Leukemia Characterized by Distinct Gene Expression Signatures
Katalin Gyurina, Bettina Kárai, Anikó Ujfalusi, Zsuzsanna Hevessy, Gábor Barna, Pál Jáksó, Gyöngyi Pálfi-Mészáros, Szilárd Póliska, Beáta Scholtz, János Kappelmayer, Gábor Zahuczky, Csongor Kiss
Frontiers in Oncology.2019;[Epub] CrossRef - Investigation of Longitudinal Data Analysis: Hierarchical Linear Model and Latent Growth Model Using a Longitudinal Nursing Home Dataset
Juh Hyun Shin, In-Soo Shin
Research in Gerontological Nursing.2019; 12(6): 275. CrossRef - Combining Microfractures, Autologous Bone Graft, and Autologous Matrix-Induced Chondrogenesis for the Treatment of Juvenile Osteochondral Talar Lesions
Riccardo D’Ambrosi, Camilla Maccario, Chiara Ursino, Nicola Serra, Federico Giuseppe Usuelli
Foot & Ankle International.2017; 38(5): 485. CrossRef - The assumption of sphericity in repeated-measures designs: What it means and what to do when it is violated
David M. Lane
The Quantitative Methods for Psychology.2016; 12(2): 114. CrossRef - Regional Coherence Alterations Revealed by Resting-State fMRI in Post-Stroke Patients with Cognitive Dysfunction
Cheng-Yu Peng, Yu-Chen Chen, Ying Cui, Deng-Ling Zhao, Yun Jiao, Tian-Yu Tang, Shenghong Ju, Gao-Jun Teng, Xi-Nian Zuo
PLOS ONE.2016; 11(7): e0159574. CrossRef - Evaluation of an Ophthalmic Anesthesia Simulation System for Regional Block Training
Biswarup Mukherjee, Jaichandran V. Venkatakrishnan, Boby George, Mohanasankar Sivaprakasam
Ophthalmology.2015; 122(12): 2578. CrossRef - What repeated measures analysis of variances really tells us
Younsuk Lee
Korean Journal of Anesthesiology.2015; 68(4): 340. CrossRef
 ePub Link
 Cite
CiteStatistical notes for clinical researchers: A one-way repeated measures ANOVA for data with repeated observations
Statistical notes for clinical researchers: A one-way repeated measures ANOVA for data with repeated observations
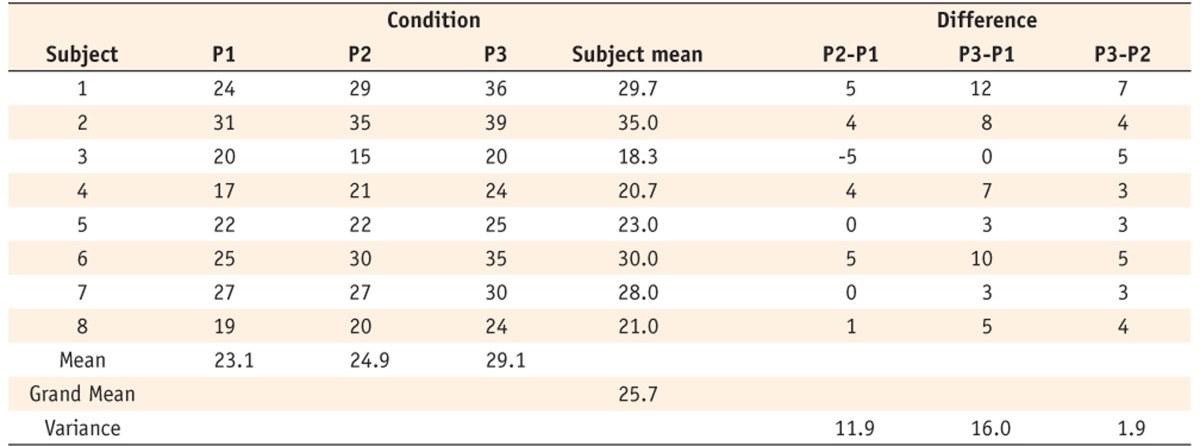
Hypothetical data with repeated observations

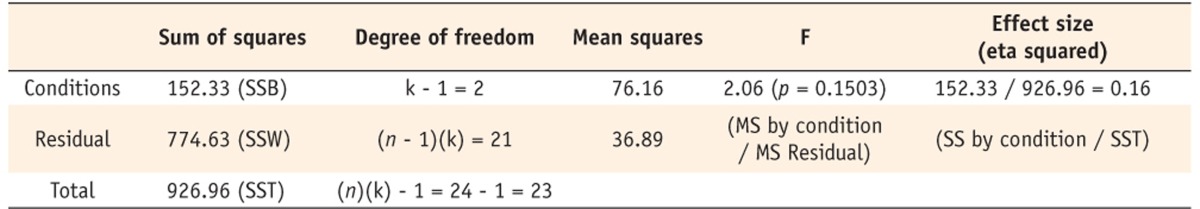
Summary table for the classical on-way ANOVA (incorrect)

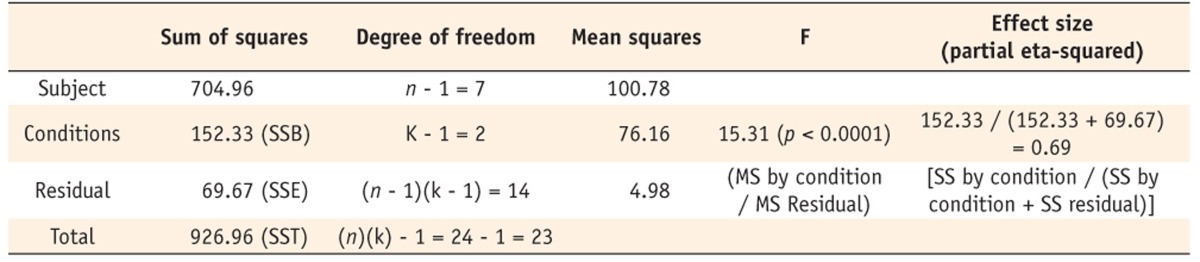
Summary table for the one-way repeated measures ANOVA

Table 1 Hypothetical data with repeated observations
Table 2 Summary table for the classical on-way ANOVA (incorrect)
Table 3 Summary table for the one-way repeated measures ANOVA

