Articles
- Page Path
- HOME > Restor Dent Endod > Volume 31(4); 2006 > Article
- Original Article A clinical evaluation of a bleaching strip containing 2.9% hydrogen peroxide
-
Eun-Sook Park1, So-Rae Seong1, Seong-Tae Hong1, Ji-Eun Kim1, So-Young Lee1, Soo-Youn Hwang1, Shin-Jae Lee2,4, Bo-Hyoung Jin3,4, Ho-Hyun Son1,4, Byeong-Hoon Cho1,4

-
2006;31(4):-281.
DOI: https://doi.org/10.5395/JKACD.2006.31.4.269
Published online: July 31, 2006
1Department of Conservative Dentistry, School of Dentistry, Seoul National University, Seoul, Korea.
2Department of Orthodontics, School of Dentistry, Seoul National University, Seoul, Korea.
3Department of Preventive Dentistry, School of Dentistry, Seoul National University, Seoul, Korea.
4Dental Research Institute, Seoul National University, Seoul, Korea.
- Corresponding Author: Byeong-Hoon Cho. Dept. of Conservative Dentistry, School of Dentistry, and Dental Research Institute, Seoul National University, 28-2 Yeongun-dong, Chongro-gu, Seoul, Korea 110-749. Tel: +82-2-2072-3514, Fax: +82-2-764-3514, chobh@snu.ac.kr
Copyright © 2006 Korean Academy of Conservative Dentistry
- 1,436 Views
- 3 Download
- 8 Crossref
Abstract
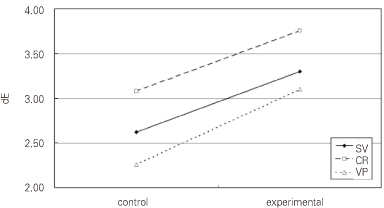
- This study evaluated the effectiveness and safety of an experimental bleaching strip (Medison dental whitening strip, Samsung medical Co., Anyang, Korea) containing 2.9% hydrogen peroxide. Twenty-three volunteers used the bleaching strips for one and a half hour daily for 2 weeks. As control group, the same strips in which hydrogen peroxide was not included were used by 24 volunteers with the same protocol. The shade change (ΔE*, color difference) of twelve anterior teeth was measured using Shade Vision (X-Rite Inc., S.W. Grandville, MI, USA), Chroma Meter (Minolta Co., Ltd. Osaka, Japan) and Vitapan classical shade guide (Vita Zahnfabrik, Germany). The shade change of overall teeth in the experimental group was significantly greater than that in the control group (p < 0.05) and was easily perceivable. The change resulted from the increase of lightness (CIE L* value) and the decrease of redness (CIE a* value) and yellowness (CIE b* value). The shade change of individual tooth was greatest in canine, and smallest in central incisor. The safety of the bleaching strip was also confirmed.
- 1. Brown G. Factors influencing successful bleaching of the discolored root-filled tooth. Oral Surg Oral Med Oral Pathol. 1965;20: 238-244.ArticlePubMed
- 2. Friedman S, Rotstein I, Libfeld H, Stabholz A, Heling I. Incidence of external root resorption and esthetic results in 58 bleached pulpless teeth. Endod Dent Traumatol. 1988;4: 23-26.ArticlePubMed
- 3. Nathoo SA. The chemistry and mechanisms of extrinsic and intrinsic discoloration. J Am Dent Assoc. 1997;128: suppl. 6S-10S.ArticlePubMed
- 4. Haywood VB, Heymann HO. Nightguard vital bleaching. Quintessence Int. 1989;20: 173-176.PubMed
- 5. Haywood VB, Heymann HO. Nightguard vital bleaching: how safe is it? Quintessence Int. 1991;22: 515-523.PubMed
- 6. Park SH, Moon HS, Han SB. The efficacy and safety of 6% hydrogen peroxide as home tooth bleaching gel. J Korean Acad Periodontol. 1994;24: 433-440.
- 7. Park DY, Jung SH, Ma DS, Chang SY, Yun SY. Randomized controlled clinical trial of the efficacy and safety of a 2.6 % hydrogen peroxide containing tooth - whitening strips. J Korean Acad Dent Health. 2002;26: 385-396.
- 8. Gerlach RW, Gibb RD, Sagel PA. A randomized clinical trial comparing a novel 5.3% hydrogen peroxide whitening strip to 10%, 15%, and 20% carbamide peroxide tray-based bleaching systems. Compend Contin Educ Dent Suppl. 2000;(29):S22-S28.PubMed
- 9. O'Brien WJ, Groh CL, Boenke KM. A new, small-color-difference equation for dental shades. J Dent Res. 1990;69: 1762-1764.ArticlePubMedPDF
- 10. Seghi RR, Gritz MD, Kim J. Colorimetric changes in composites resulting from visible-light-initiated polymerization. Dent Mater. 1990;6: 133-137.ArticlePubMed
- 11. Asmussen E. An accelerated test for color stability of restorative resins. Acta Odontol Scnad. 1982;39: 329-332.Article
- 12. Gross MD, Moser JB. A colorimetric study of coffee and tea staining of four composite resins. J Oral Rehabil. 1977;4: 311-322.ArticlePubMed
- 13. Ruyter IE, Nilner K, Moller B. Color stability of dental composite resin materials for crown and bridge veneers. Dent Mater. 1987;3: 246-251.ArticlePubMed
- 14. Al Shethri S, Matis BA, Cochran MA, Zekonis R, Stropes M. A clinical evaluation of two in-office bleaching products. Oper Dent. 2003;28: 488-495.PubMed
- 15. Zekonis R, Matis BA, Cochran MA, Al Shethri SE, Eckert GJ, Carlson TJ. Clinical evaluation of in-office and at-home bleaching treatments. Oper Dent. 2003;28: 114-121.PubMed
- 16. Sulieman M, Addy M, Rees JS. Development and evaluation of a method in vitro to study the effectiveness of tooth bleaching. J Dent. 2003;31: 415-422.ArticlePubMed
- 17. Tavares M, Stultz J, Bewman M, Smith V, Kent R, Carpino E, Goodson JM. Light augments tooth whitening with peroxide. J Am Dent Assoc. 2003;134: 167-175.ArticlePubMed
REFERENCES


§O'Brien WJ, Groh CL, Boenke KM9). A new, small-color-difference equation for dental shades. J Dent Res 69:1762-1764, 1990.

Abbreviations; tx: treatment, R: correlation coefficient between the measrements before treatment and the changes after treatment, SD: standard deviation, D: mean differences, NS: not significant
*, **, and *** mean p < 0.05, p < 0.01, and p < 0.001, respectively.
Sample numbers of overall measurements: Control, n = 288; Experimental, n = 276)
Sample numbers of each tooth measurements: Control, n = 24; Experimental, n = 23)


§The shade code of each tab in Vita classical shade guide were converted to ordinal values by the descending-ordered brightness sequence.

Tables & Figures
REFERENCES
Citations

- Effect of at-home agents and concentrations on bleaching efficacy: A systematic review and network meta-analysis
Renata Maria Oleniki Terra, Michael Willian Favoreto, Tom Morris, Alessandro D. Loguercio, Alessandra Reis
Journal of Dentistry.2025; 160: 105857. CrossRef - Effects of Citrus limon Extract on Oxidative Stress-Induced Nitric Oxide Generation and Bovine Teeth Bleaching
Soon-Jeong Jeong
Journal of Dental Hygiene Science.2021; 21(2): 96. CrossRef - Efficacy of a self - applied paint - on whitening gel combined with wrap
Soo-Yeon Kim, Jae-Hyun Ahn, Ji-Young Kim, Jin-Woo Kim, Se-Hee Park, Kyung-Mo Cho
Journal of Dental Rehabilitation and Applied Science.2018; 34(3): 175. CrossRef - Effects of a whitening strip combined with a desensitizing primer on tooth color
Hae-Eun Shin, Sang-Uk Im, Eun-Kyung Kim, Jong-Hun Kim, Jae-Hyun Ahn, Youn-Hee Choi, Keun-Bae Song
Journal of Korean Academy of Oral Health.2016; 40(1): 31. CrossRef - A clinical evaluation of efficacy of an office bleaching gel containing 30% hydrogen peroxide
Sin-Young Kim, Je-Uk Park, Chang-Hyen Kim, Sung-Eun Yang
Journal of Korean Academy of Conservative Dentistry.2010; 35(1): 40. CrossRef - The evaluation of clinical efficacy and longevity of home bleaching without combined application of In-office bleaching
Byunk-Gyu Shin, Sung-Eun Yang
Journal of Korean Academy of Conservative Dentistry.2010; 35(5): 387. CrossRef - Effect of the bleaching light on whitening efficacy
Jong-Hyun Park, Hye-Jin Shin, Deok-Young Park, Se-Hee Park, Jin-Woo Kim, Kyung-Mo Cho
Journal of Korean Academy of Conservative Dentistry.2009; 34(2): 95. CrossRef - Clinical study of shade improvement and safety of polymer-based pen type BlancTic Forte whitening agent containing 8.3% Carbamide peroxide
Jin-Kyung Lee, Sun-Hong Min, Sung-Tae Hong, So-Ram Oh, Shin-Hye Chung, Young-Hye Hwang, Sung-Yeop You, Kwang-Shik Bae, Seung-Ho Baek, Woo-Cheol Lee, Won-Jun Son, Kee-Yeon Kum
Journal of Korean Academy of Conservative Dentistry.2009; 34(2): 154. CrossRef


Figure 1
Figure 2
Figure 3
Figure 4
CIE Lab* values§ of each shade tab coded in the Vita classical shade guide and their ordinal values converted by the descending-ordered brightness sequence
§O'Brien WJ, Groh CL, Boenke KM9). A new, small-color-difference equation for dental shades. J Dent Res 69:1762-1764, 1990.
Age and gender of the participants in the study
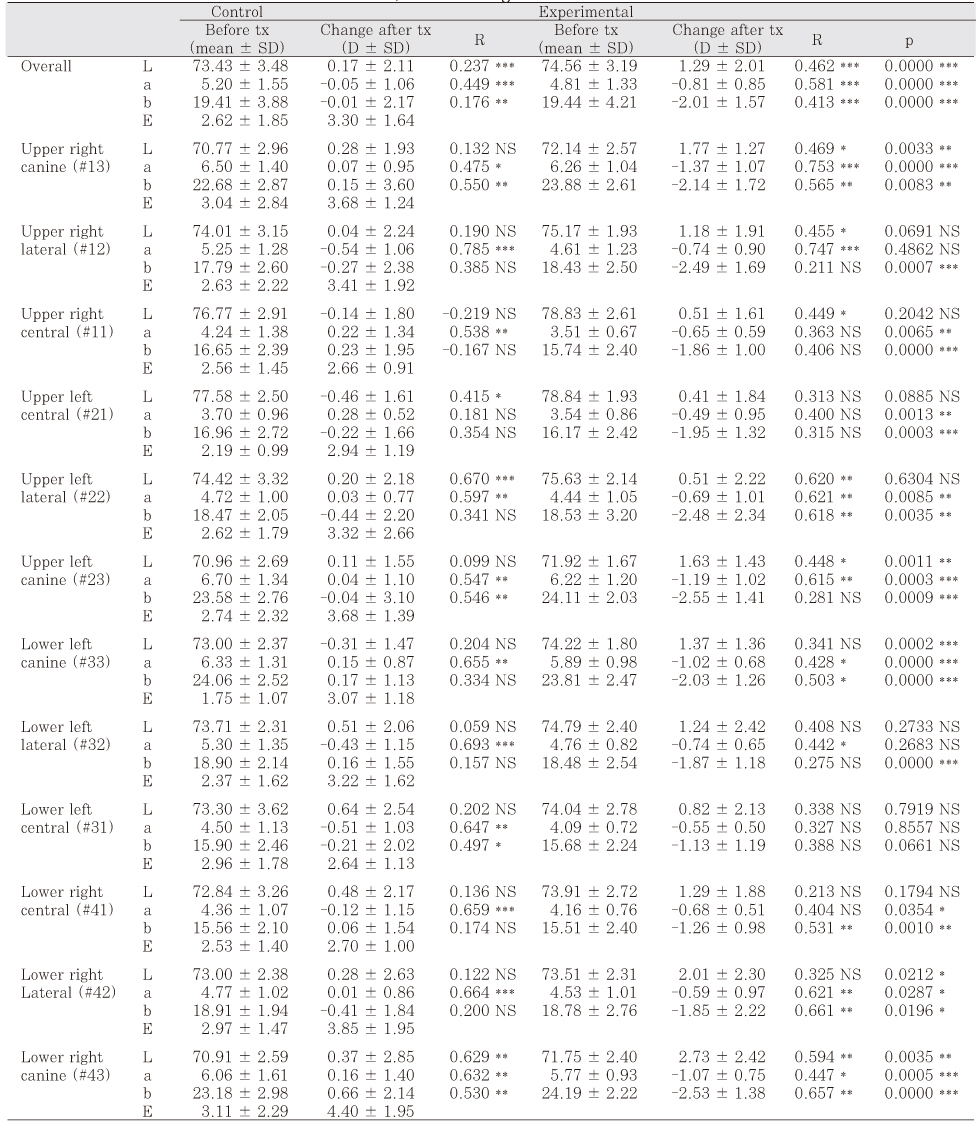
Shade Vision: color measurements, color changes and their statistical results
Abbreviations; tx: treatment, R: correlation coefficient between the measrements before treatment and the changes after treatment, SD: standard deviation, D: mean differences, NS: not significant
*, **, and *** mean p < 0.05, p < 0.01, and p < 0.001, respectively.
Sample numbers of overall measurements: Control, n = 288; Experimental, n = 276)
Sample numbers of each tooth measurements: Control, n = 24; Experimental, n = 23)
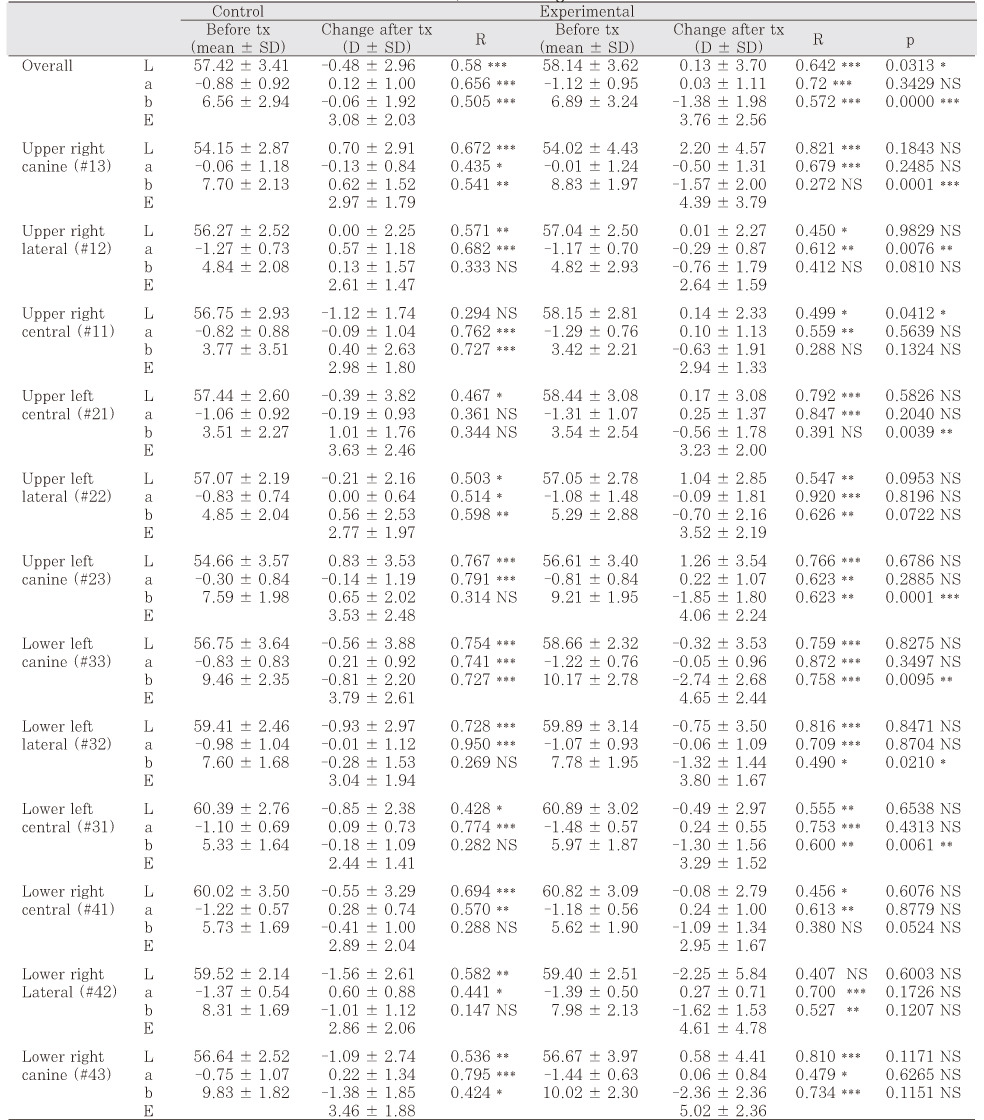
Chroma Meter CR 321: color measurements, color changes and their statistical results
Abbreviations; tx: treatment, R: correlation coefficient between the measrements before treatment and the changes after treatment, SD: standard deviation, D: mean differences, NS: not significant
*, **, and *** mean p < 0.05, p < 0.01, and p < 0.001, respectively.
Sample numbers of overall measurements: Control, n = 288; Experimental, n = 276)
Sample numbers of each tooth measurements: Control, n = 24; Experimental, n = 23)
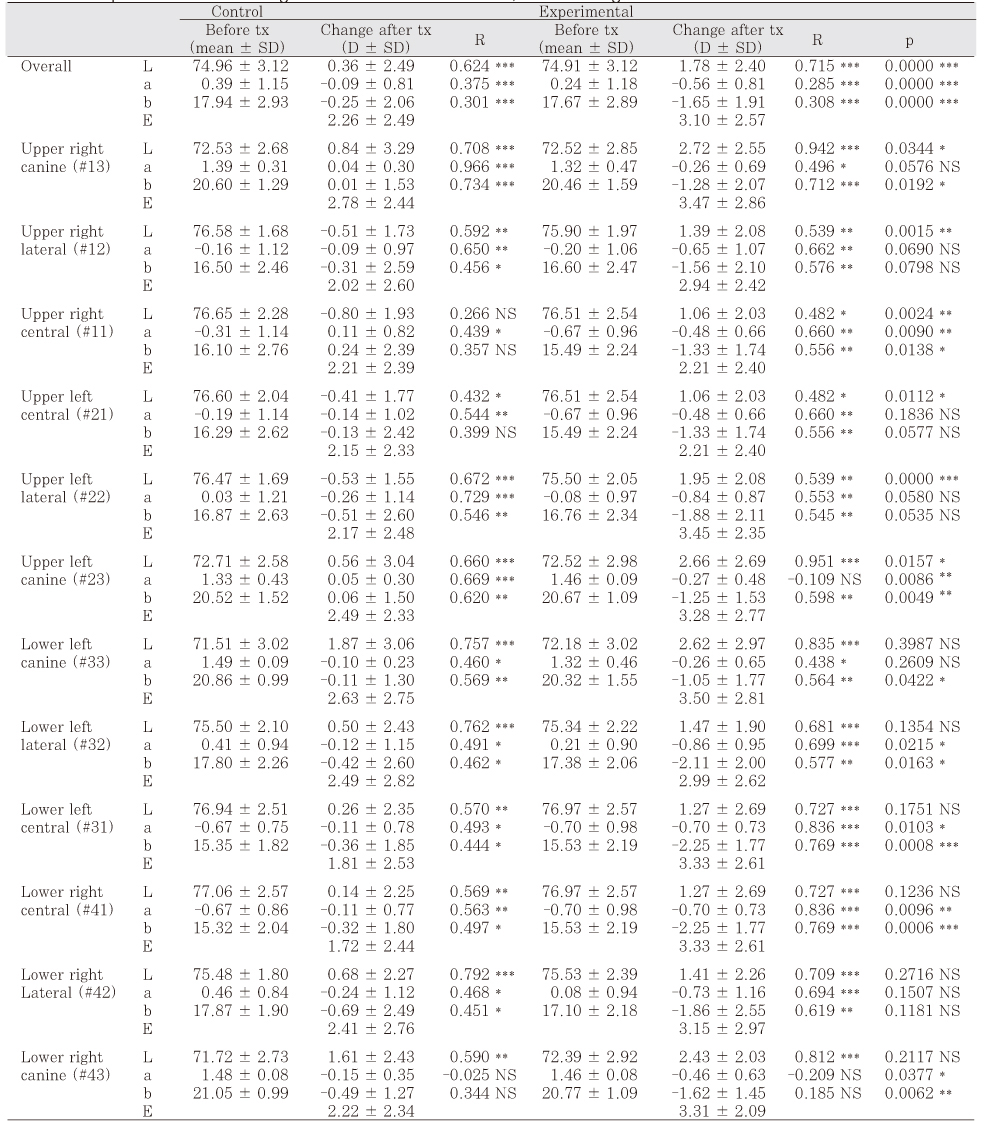
Vitapan classical shade guide: color measurements, color changes and their statistical results
Abbreviations; tx: treatment, R: correlation coefficient between the measrements before treatment and the changes after treatment, SD: standard deviation, D: mean differences, NS: not significant
*, **, and *** mean p < 0.05, p < 0.01, and p < 0.001, respectively.
Sample numbers of overall measurements: Control, n = 288; Experimental, n = 276)
Sample numbers of each tooth measurements: Control, n = 24; Experimental, n = 23)
Gingival inflammation index, Plaque index, and change in Electric pulp test scores before and after bleaching with experimental and control strips
Initial ordinal shade values§ of the experimental and control groups measured using Shade Vision and Vitapan classical shade guide and their changes after bleaching study
§The shade code of each tab in Vita classical shade guide were converted to ordinal values by the descending-ordered brightness sequence.
§O'Brien WJ, Groh CL, Boenke KM
Abbreviations; tx: treatment, R: correlation coefficient between the measrements before treatment and the changes after treatment, SD: standard deviation, D: mean differences, NS: not significant *, **, and *** mean p < 0.05, p < 0.01, and p < 0.001, respectively. Sample numbers of overall measurements: Control, n = 288; Experimental, n = 276) Sample numbers of each tooth measurements: Control, n = 24; Experimental, n = 23)
Abbreviations; tx: treatment, R: correlation coefficient between the measrements before treatment and the changes after treatment, SD: standard deviation, D: mean differences, NS: not significant *, **, and *** mean p < 0.05, p < 0.01, and p < 0.001, respectively. Sample numbers of overall measurements: Control, n = 288; Experimental, n = 276) Sample numbers of each tooth measurements: Control, n = 24; Experimental, n = 23)
Abbreviations; tx: treatment, R: correlation coefficient between the measrements before treatment and the changes after treatment, SD: standard deviation, D: mean differences, NS: not significant *, **, and *** mean p < 0.05, p < 0.01, and p < 0.001, respectively. Sample numbers of overall measurements: Control, n = 288; Experimental, n = 276) Sample numbers of each tooth measurements: Control, n = 24; Experimental, n = 23)
§The shade code of each tab in Vita classical shade guide were converted to ordinal values by the descending-ordered brightness sequence.

 KACD
KACD

 ePub Link
 Cite
Cite

