
Articles
- Page Path
- HOME > Restor Dent Endod > Volume 51(1); 2026 > Article
- Research Article Cone-beam computed tomography analysis of maxillary premolar canal anatomy: Ahmed’s versus Vertucci’s classifications in a Jordanian cohort
-
Raidan Ba-Hattab1
 , Muna M. Shaweesh2, Nessrin A. Taha3,*, Elham S. Abu Alhaija4
 -
Restor Dent Endod 2026;51(1):e11.
DOI: https://doi.org/10.5395/rde.2026.51.e11
Published online: February 26, 2026
1Department of Pre-Clinical Oral Health Sciences, College of Dental Medicine, QU Health, Qatar University, Doha, Qatar
2Al Thumamah Health Center, Primary Health Care Corporation, Doha, Qatar
3Department of Conservative Dentistry, Faculty of Dentistry, Jordan University of Science and Technology, Irbid, Jordan
4Department of Clinical Oral Health Sciences, College of Dental Medicine, QU Health, Qatar University, Doha, Qatar
- *Correspondence to Nessrin A. Taha, BDS, MFDS, GradDipClinDent, DClinDent (Endo), FRACDS, FRACDs (Endo), PhD Department of Conservative Dentistry, Faculty of Dentistry, Jordan University of Science and Technology, Irbid 22110, Jordan Email: n.taha@just.edu.jo
• Received: July 10, 2025 • Revised: November 26, 2025 • Accepted: December 9, 2025
© 2026 The Korean Academy of Conservative Dentistry
This is an Open-Access article distributed under the terms of the Creative Commons Attribution Non-Commercial License (http://creativecommons.org/licenses/by-nc/4.0) which permits unrestricted non-commercial use, distribution, and reproduction in any medium, provided the original work is properly cited.
- 1,014 Views
- 55 Download
Abstract
-
Objectives This study analyzed the root and canal configurations of maxillary premolars in a Jordanian subpopulation using cone-beam computed tomography (CBCT) and classified them based on Vertucci’s and Ahmed’s systems.
-
Methods Two hundred CBCT scans of 800 maxillary premolars were retrospectively assessed for root morphology, canal configurations, and root canal divergence and merging. Data was statistically analyzed.
-
Results The study included 70 males and 130 females. Most right and left maxillary first premolars (RFPM, LFPM) had two roots (59.0% and 58.5%), with a significant association between sex and root number for RFPM and LFPM (p < 0.05). In contrast, the right and left maxillary second premolars (RSPM, LSPM) mostly had a single root (87.5% and 88.5%), with no association with sex. Vertucci’s classification showed type IV as the predominant configuration in first premolars (RFPM, 65.0% and LFPM, 67.0%) and type I in second premolars (RSPM, 44.0% and LSPM, 49.0%). A significant sex association was found only with RSPM. Ahmed’s classification revealed that maxillary premolar with two separated roots and two separated canals (2MP B1 P1) was mostly found in first premolars (RFPM, 58.0% and LFPM, 56.0%), and maxillary premolar with one root and one canal (1MP1) in second premolars (RSPM, 44.0% and LSPM, 49.0%), with a significant sex association for RSPM and LSPM (p < 0.05). Age had no impact, and symmetry was observed between the right and left sides. Three-rooted premolars were identified in four cases. Almost all of Vertucci’s types and numerous codes from Ahmed’s classification were documented.
-
Conclusions CBCT revealed diverse anatomical variations in the Jordanian subpopulation, with Ahmed’s classification providing more detailed canal configurations than Vertucci’s, uncovering previously overlooked variations.
INTRODUCTION
Understanding tooth morphology is a key to successful endodontic treatment [1]. One of the main reasons for treatment failure and the need for retreatment is the presence of untreated root canals, which can occur due to the complex, varied structure of the root and its canal system. These complex systems harbor hidden microbial infections [2].
Over the years, several classification systems have been developed by Wein [3] and Vertucci [4] to describe the different root canal configurations. Vertucci [4] described eight standard canal configurations (types I–VIII) based on the ways canals branch and rejoin from the pulp chamber to the apex, a system that is still commonly applied. However, the diversity of tooth anatomy and root canal configurations reveals limitations in existing classifications. Furthermore, the increasing use of advanced imaging techniques has uncovered many previously unrecognized anatomical complexities [4]. To overcome this limitation, Ahmed et al. [5] proposed a coding method in which (i) the number of roots is indicated as a superscript before the tooth code, and (ii) the canal configuration for each root is noted as superscripts following the tooth code (for instance, 2MP B1 P1 denotes a maxillary premolar with two roots, each containing a single independent canal). This approach enables the detailed notation of canal divergence and convergence within individual roots (e.g., MP1-2-1, signifying a 1-2-1 canal pathway), providing greater accuracy than earlier classification systems [5].
Historically, various methods have been employed to study the internal and external anatomies of teeth. The in vitro clearing method involved several complex steps for preparing the teeth before injecting the ink, in preparation for examining the tooth canals [6]. Certain clinical studies employed the SLOB (Same Lingual, Opposite Buccal) technique, using two radiographs from different angulations and magnifying loupes to facilitate inspection of the pulp chamber floor and localization of root canal orifices [7].
Two previous studies have examined maxillary premolars in the Jordanian population. Awawdeh et al. [6] using extracted teeth and India ink, found that the first premolars were predominantly two-rooted with a Vertucci’s system type IV canal configuration, though rarer configurations, such as Vertucci's system type XVI (2–3), where two canals leave the chamber; one subdivides, so the root ends with three foramina, were also observed. The prevalence of multiple canals (79.7%) in maxillary premolars was higher than in other populations, underscoring the importance of accounting for these variations in endodontic treatment [6]. Al-Ghananeem et al. [7] conducted a study on maxillary second premolars in a Jordanian population, examining 217 teeth to determine the number of roots and canals. The study utilized parallel and cone-shift radiographic techniques during routine endodontic procedures, and canal orifices were identified using 3.5× magnification loupes. The results revealed that 55.3% of the teeth had a single root, 44.2% had two roots, and 0.46% had three roots. In terms of root canal configurations, classified using Vertucci’s system, 13.8% of the teeth had type I, 24.9% had type II, 60.8% had type IV, and 0.46% had type VIII.
Cone-beam computed tomography (CBCT) in dentistry has significantly enhanced diagnostic capabilities by providing detailed three-dimensional (3D) views of both internal structures and surrounding anatomy in coronal, sagittal, and axial planes [8]. Additionally, it has simplified the root and canal configuration procedure [9,10]. In contrast, the two-dimensional nature of periapical radiographs can lead to the missed detection of roots and canals [8]. While micro computed tomography (micro-CT) is recognized as a more accurate radiological technique for examining tooth morphology due to its higher resolution, it subjects patients to much higher radiation doses [11]. Despite this advancement, no previous study has examined the morphology of the roots and canals in Jordanian maxillary premolars using CBCT, nor has it compared the Vertucci’s and Ahmed’s classifications simultaneously. Therefore, the aim of this study was to assess the root morphology and canal configurations in a Jordanian subpopulation using CBCT scans, applying the Vertucci’s and Ahmed’s classification systems, and to compare these findings with those obtained using conventional techniques.
METHODS
This retrospective cross-sectional study was reported in accordance with the STROBE (Strengthening the Reporting of Observational Studies in Epidemiology) guidelines [12]. Ethical approval was obtained from the Institutional Research Committee of Jordan University of Science and Technology (JUST) in Irbid, Jordan, under protocol number 2023/161/36.
The CBCT images analyzed in this study were initially obtained for various diagnostic purposes as part of comprehensive treatment planning at JUST’s Dental Teaching Clinics in the period from September 2016 to September 2022. As the data were anonymized and no additional interventions were involved, the ethics committee waived informed consent.
The sample size was calculated using a sample size calculator (RaoSoft, Seattle, WA, USA) with a 50% prevalence, a 5% margin of error, and a 95% confidence interval, yielding a target sample size of 384 teeth per type.
The inclusion criteria were CBCT scans of bilateral maxillary first and second premolars with fully developed apices obtained from subjects aged 13 years or older, provided that the scans were of sufficient quality to allow visualization of individual root and canal morphology and had voxel sizes of 0.2 mm or smaller.
Exclusion criteria included the following: missing contralateral premolar, immature teeth, teeth in which individual roots or canals were not clearly visualized, or that showed evidence of prior dental treatment or surgery altering the natural anatomy (e.g., root canal treatment, posts, metal restorations, ‘apicoectomy,’ root resection, resorption, etc.).
CBCT scans were taken using a CS 9500 cone-beam 3D system (Carestream Health, Rochester, NY, USA) with a flat-panel detector. The CBCT machine’s parameters were as follows: tube current, 10 mA; tube voltage, 90 kVp; and focal spot diameter, 0.6 mm. The possible voxel size is 0.20 or less, with an exposure time of 8.01 seconds.
The CBCT scans were analyzed independently by two specialists with 15 years of clinical experience, who were calibrated prior to the assessment using 20 CBCT scans of maxillary premolar teeth showing root canal morphology according to the Vertucci’s and Ahmed’s classification systems (Figure 1). Inter- and intra-examiner reliability was assessed with a 3-week interval between the first and second assessments. Disagreements were resolved through open discussion and a consensus-based approach.
The DICOM files were analyzed using Blue Sky Plan 64-bit (V4.13.64-bit; Blue Sky Bio, LLC, Libertyville, IL, USA), with adjustments to contrast, brightness, and sharpness to improve visualization. Three planes (axial, coronal, and sagittal) were assessed for tooth anatomy based on the following criteria: (1) root morphology, including i) root numbers, classified into single, double, or three-rooted [11] and ii) root bifurcation, assessed by means of a software ruler and divided into three equal sections (coronal, middle, and apical) as per Saber et al [11]; (2) root canal configuration: categorized based on Vertucci’s scheme [4] and the updated coding system of Ahmed et al. [5]; and (3) levels of divergence and merging in root canals, measured using a software ruler by dividing each root canal into three equal portions (coronal, middle, and apical), as described in previous studies [11,13].
Sex and age were recorded. Age was divided into five groups in accordance with a previous report [14]: (1) 13–24 years; (2) 25–34 years; (3) 35–44 years; (4) 45–54 years; (5) ≥55 years.
Data analysis was conducted using IBM SPSS Statistics ver. 29.0 (IBM Corp., Armonk, NY, USA). The Pearson chi-square test evaluated the association of root canal morphologies based on Vertucci’s and Ahmed’s classifications across age and sex. Analysis of variance and independent t-tests were used to compare canal divergence and merging levels. The significance level was set at p < 0.05.
RESULTS
The kappa coefficients indicated excellent reliability, with inter-examiner values ranging from 0.803 to 1 and intra-examiner values ranging from 0.854 to 1.
A total of 200 patients’ scans have been included, meeting the inclusion criteria (400 maxillary first premolars and 400 maxillary second premolars), with 140 males (35%) and 260 females (65%). The subjects’ ages ranged from 13 to 72 years (mean age, 22.8 years).
1. Maxillary first premolars
The majority of the right maxillary first premolars (RFPM) had two roots (118/200, 59%), occurring in 71.4% of males and 52.3% of females. Likewise, the majority of the left maxillary first premolars (LFPM) had two roots (117/200, 58.5%), with frequencies of 67.1% in males and 53.8% in females. Single-rooted RFPMs were less common, occurring in 81 of 200 teeth (40.5%), with a prevalence of 47.7% in females and 27.1% in males. In LFPM, single roots were also less common (82/200, 41.0%), occurring in 46.2% of females and 31.4% of males. Three-rooted configurations were rare, occurring in only 0.5% of both RFPM and LFPM, and were exclusively observed in males. The association between root number and sex was statistically significant in both RFPM and LFPM (p = 0.004 and p = 0.039, respectively).
2. Maxillary second premolars
The right maxillary second premolars (RSPM) had mostly a single root (175/200, 87.5%), with 81.4% occurring in males and 90.8% in females. Similarly, most left maxillary second premolars (LSPM) had one root (177/200, 88.5%), with a rate of 84.3% in males and 90.8% in females. Two-rooted RSPM were less frequent, found in 25 out of 200 teeth (12.5%), with 18.6% in males and 9.2% in females. In LSPM, two roots were also less common (21/200, 10.5%), with 14.3% in males and 8.5% in females. Three-rooted configurations were rare, occurring in only one case each for LSPM in both sexes. The association between root number and sex was not statistically significant for either RSPM or LSPM (p ≥ 0.05).
3. Bifurcation location
In RFPM, most buccal and palatal root bifurcations were located in the middle third of the roots (56.3%), followed by the coronal and apical thirds (31.1% and 12.6%), respectively. Similarly, in LFPM, bifurcations were mainly found in the middle third of the roots (59.2%), followed by the coronal (29.2%) and apical thirds (11.6%). In RSPM, bifurcations were equally common in the middle and apical thirds (39.1%), followed by the coronal third (21.8%). In LSPM, bifurcations were most common in the middle third (47.6%), then the apical third (38.1%), and least common in the coronal third (14.3%). No association was found between root bifurcation level and sex (p > 0.05).
1. Maxillary first premolars
In both RFPM and LFPM, type IV was the most common canal configuration, seen in 65.0% and 67.0% of cases, respectively. Type V followed at 13.5% in RFPM and 12.5% in LFPM. In RFPM, types II and III were found in 7.5% and 6.0% of cases, respectively, while type I was slightly less common at 5.5%. Rare configurations included types VII and VIII, appearing in only 2.0% and 0.5% of cases, respectively, and type VI was not observed at all. In LFPM, types I and II accounted for 7.5% and 8.0%, respectively, while type III was slightly less frequent at 4.0%. The rarest configurations included types VI and VIII, each appearing in only 0.5% of cases, with type VII not observed at all. The association between canal configurations based on Vertucci and sex was not significant.
2. Maxillary second premolars
In both RSPM and LSPM, the most prevalent Vertucci’s classification was type I (44.0% in RSPM, 49.0% in LSPM), followed by type V (22.5% in RSPM, 23.0% in LSPM). Less common types included type IV (16.0% in RSPM, 12.0% in LSPM) and type III (13.0% in RSPM, 9.0% in LSPM). Rare types included type II (3.0% in both RSPM and LSPM). The least frequent types in RSPM were type VII (1.0%), type VI (0.5%), and no cases of type VIII. In LSPM, type VI (2.5%), type VIII (1.0%), and type VII (0.5%) were the least common.
A significant association between sex and Vertucci’s classification was found in RSPM (p = 0.029) but not in LSPM (p = 0.053).
1. Maxillary first premolars
In both right (RFPM) and left first premolars (LFPM), the most common canal configuration was 2MP B1 P1 (58.0% in RFPM, 56.0% in LFPM), followed by 1MP1-2 (12.5% in RFPM, 11.5% in LFPM). Other configurations, such as 1MP2-1, 1MP2, 1MP1, and 1MP1-2-1, were observed with percentages ranging from 4.5% to 9.0%. Rare types included 1MP1-2-1-2, 2MP 1B1 P1, and 3MP 1(MB1 DB1) P1, with none of the cases exhibiting 1MP2-1-2 in RFPM or 1MP1-2-1-2 in LFPM. There was no significant sex association with Ahmed’s classification for RFPM (p = 0.064) or LFMP (p = 0.446).
2. Maxillary second premolars
In both RSPM LSPM, the most common canal configuration was 1MP1 (44.0% in RSPM, 49.0% in LSPM), followed by 1MP1-2 (18.0% in RSPM, 20.0% in LSPM) and 1MP1-2-1 (13.0% in RSPM, 9.5% in LSPM). Less prevalent types included 2MP B1 P1 and 1MP2, with rare configurations like 1MP2-1, 1MP2-1-2, and 1MP1-2-1-2, while 3MP 1(MB1 DB1) P1 was either absent or very rare. The association between sex and Ahmed’s classification was statistically significant for both sides, with p = 0.0381 for RSPM and p = 0.023 for LSPM.
When analyzing Vertucci’s classification of maxillary first premolars across different age groups, no statistically significant association with age was found. Type IV is the most common among all age groups for both RFPM and LFPM, with the highest prevalence observed in the 13–24-year age group (66.4% for RFPM and 64.9% for LFPM). All other types of Vertucci’s classification were also observed, except for type VI (Table 4).
Similarly, when examining Vertucci’s classification of maxillary second premolars across different age groups, no statistically significant association was found with age. Type I is the most common among all age groups for both RSPM and LSPM, with the highest prevalence observed in the 13–24- and 25–34-year age groups (43.3% for RSPM and 50% for LSPM). Among patients aged 55 years or older, there was an equal distribution of types I, II, and IV (33.3% each) in LSPM. All other types of Vertucci’s classification were also observed.
For the maxillary first premolars, the most prevalent root and canal configuration was 2MP B1 P1 across all age groups, with a total of n = 228/400 (57.0%), followed by 1MP1-2 with total n = 48/400 (12.0%). The association between age and Ahmed’s classification was not statistically significant on either the right or left side (p > 0.05).
For the maxillary second premolar, the most prevalent configuration across all age groups was 1MP1, comprising 186/400 (46.5%), followed by 1MP1-2, which accounted for 75/400 (19.0%). The association between age and Ahmed’s classification was statistically insignificant for both the right and left (p > 0.05) sides.
The levels of merging and diverging of canals are summarized in Table 6. In the 1MP2-1 configuration, canal merging occurred at the middle of the root for both RFPM and LFPM, while in the apical third in RSPM and LSPM. There was no statistical significance in the level of merging across the teeth.
For the 1MP1-2 configuration, the divergence occurred at the middle of the root for RSPM and LSPM, whereas divergence occurred apically for RFPM and LFPM. Again, there was no significant difference in divergence levels across all teeth (p > 0.05).
In all right and left maxillary premolars, merging and diverging of the canals having the configuration 1MP2-1-2 occurred at the middle and apical levels, respectively; however, this was not statistically significant (p > 0.05).
In canals with 1MP1-2-1-2 configuration, divergence occurred at the coronal level, merging at the middle root level, and divergence again at the apical root, which was observed only in right-side teeth. The apical divergence in this configuration was statistically significant (p < 0.001).
DISCUSSION
Root canal treatment failure, especially in posterior teeth such as molars and premolars, can occur due to the inability to identify and disinfect canals, resulting from a lack of knowledge of internal canal anatomy [15].
Advances in radiographic technology have made CBCT an increasingly valuable tool in dentistry, resulting in significant progress in diagnosing and evaluating oral disorders [16]. Numerous studies have demonstrated greater accuracy in identifying additional canals with CBCT than with conventional intraoral radiography [17,18].
This study investigated the root and canal morphology of maxillary premolars in a Jordanian subpopulation using CBCT, using two systems: Vertucci’s and Ahmed’s classifications [4,5].
Our study revealed a higher prevalence of two-rooted maxillary first premolars (Table 1), consistent with a previous study among the Jordanian population, which found that 63.2% of the studied teeth had two roots [6]. This result was consistent across both RFPM (59.0%) and LFPM (58.5%), indicating symmetry. Similarly, results from other populations have shown a high prevalence of double-rooted teeth, as in the Egyptian population (53.1%) [11] and the South African population (54.1%) [19]. The effect of sex was statistically significant (Table 1), with females having a relatively high likelihood of having a single-rooted maxillary first premolar (RFPM, 47.7% and LFPM, 46.2%), whereas this was not the case for males (RFPM, 27.1% and LFPM, 31.4%). This finding is somewhat comparable to that of Al-Zubaidi et al. [20], who reported that women had a higher prevalence of single-rooted first premolars than men (56.5% vs 29.3%), whereas men exhibited a higher prevalence of double-rooted maxillary first premolars than women (67.2% vs 51.1%). In addition to this, although a three-rooted Maxillary first premolar is rare to be found (Table 1), it still needs to be considered, especially in males (0.5% for both RFPM and LFPM). The finding appears comparable to the pattern reported by Olczak et al. [21], who also observed a higher prevalence in males than in females (4.1% vs 1.5%), with similar frequencies on the right and left sides (2.8% and 2.3%, respectively).
It is crucial to understand the degree of root bifurcation in maxillary premolars, as it has both anatomical and clinical implications [11]. In the present study, the bifurcation level in the first premolar in more than half of the cases was in the middle third of the roots (57.8%) (Table 1), with comparable results in both RFPM (56.3%) and LFPM (59.3%), followed by the coronal third level (29.95%), with no sex difference significance. These results align with the findings of Saber et al. [11], who found that 78.9% of Egyptians had middle-level bifurcation. In contrast, Olczak et al. [21] recorded a higher incidence of bifurcation in the coronal third of the root (44.2%) in the Polish population, followed by the middle third (40.5%). Furthermore, they observed a statistically significant sex difference, with a higher incidence of the coronal bifurcation in males and a higher incidence of the middle bifurcation in females [21]. This variation might reflect racial disparities in root canal morphology, as highlighted in numerous previous studies [1]. Clinically, the bifurcation level may affect the complexity of endodontic treatment; hence, the operating microscope often enables clinicians to directly observe the site where the main canal divides into two or three branches, as well as the alignment of the canal orifices. Nevertheless, when the furcation lies deep within the tooth, or the orifices are calcified, their detection may remain difficult, even with microscopic assistance [22].
The most prevalent canal configuration in this study, according to Vertucci’s classification, was type IV (2-2) (Table 2), observed in both RFPM (65.0%) and LFPM (67.0%), and a similarly high prevalence of type IV configuration has been reported across various populations [11,19,21,23]. These findings are somewhat aligned with those of Awawdeh et al.[6], in the Jordanian population, type IV was also identified as the most prevalent configuration in maxillary first premolars with two canals, with a reported incidence of 79.7%. However, their study, conducted on 600 extracted teeth, neither assessed the association between age and sex nor considered symmetry [6]. In contrast, the current study incorporated these variables. Furthermore, Awawdeh et al. [6] reported no examples of type III, VI, or VII canals in maxillary first premolars. In the present study, type III canals were observed in a few cases, while types VI, VII, and VIII were observed rarely, with seven, seven, and four occurrences, respectively (Table 2). This enhanced detection is likely due to the use of CBCT imaging, which provides more detailed insights into canal morphology than earlier techniques.
This is the first study to use Ahmed’s classification among Jordanians. Type 2MP B1 P1 had the highest prevalence in both RFPM and LFPM (58.0% and 56.0%, respectively), with no significant differences by sex or age (Tables 3 and 5). This is in line with research by Saber et al. [11] and Buchanan et al. [19], which also revealed that 2MP B1 P1 had the highest prevalence (52.5% and 52.53%, respectively).
Using Ahmed’s classification, 10 different root canal configuration types were identified among right and left side first maxillary premolars, showing a detailed canal configuration within the root, which confirms the aim of this new classification. Different configurations based on this classification were identified, highlighting the canal’s divergence and merging levels. The location of canal divergence and merging is critical during root canal treatment, as detecting a divergence in the middle and apical thirds of the root is difficult, challenging, and may be missed [13]. For example, within the single-rooted premolars, a rare occurrence of canal divergence, followed by merging, and then again divergence was found, as indicated by code 1MP1-2-1-2, which might have been missed in previous classifications. Similarly, in two-rooted premolars, the code 2MP B1 P1 denotes a separate canal in each root, whereas 2MP 1B1 P1 describes a canal originating from the pulp chamber that bifurcates into two canals, one within each root. Such examples illustrate the greater descriptive capacity of Ahmed’s system, which, when combined with CBCT imaging, provides precise characterization of complex canal patterns.
Regarding maxillary second premolars, the results of this study showed a high prevalence of single-rooted maxillary second premolars with a percentage of 88% (87.5 % in RSPM, 88.5% in LSPM), with no association between sex and number of roots (Table 1). This finding is comparable to a previous study of the Jordanian population, which reported that of 217 maxillary second premolars, 120 (55.3%) had one root, 96 (44.2%) had two roots, and 1 (0.5%) had three roots. The study reported an almost double likelihood of females having single-rooted premolars compared to those with double-rooted ones (64% vs 36%), whereas in males, the likelihood of having double-rooted premolars is higher than that of having single-rooted ones (51.2% vs 49.9%). Additionally, three-rooted premolars were very rare, occurring in only 0.8% of cases [7]. These results are consistent with previous studies [11,19]. A recent systematic review analyzed 16,371 maxillary premolars and reported that 84.3% had a single root, suggesting that the higher prevalence of single-rooted second premolars is likely a universal trend [1]. The study reported a prevalence of three-rooted maxillary second premolars (0.3%), comparable to our 1% prevalence, observed only in LSPM. Watanabe et al. [24] reported a similar rare occurrence of three-rooted maxillary second premolar among the Japanese population (0.3%).
In the less common multirooted second premolars, it is important to consider the bifurcation level. In RSPM, bifurcation occurred equally in the middle and apical thirds of the root (39.1%) and was least frequent in the coronal third level (21.8%). A comparable distribution was observed in LSPM, where bifurcation predominantly occurred in the middle third (47.6%), followed by the apical third (38.1%), and least frequently in the coronal third (14.3%) (Table 1). Saber et al. [11] reported that the middle third bifurcation was the most prevalent (78.5%), followed by the apical third (14%). These variations may reflect true anatomical differences between populations, as well as methodological factors, such as differences in imaging protocols, with sample size potentially contributing to the observed discrepancies.
The second maxillary premolars in this study showed a high prevalence of type I Vertucci’s Classification (44% in RSPM, 49% in LSPM), followed by type V (22.5% in RSPM, 23% in LSPM) across all age groups (Table 4). This finding differs from a previous study conducted among the Jordanian population, which reported a higher prevalence of type IV at 60.8%, while type I was observed in only 13.8% [7]. Discrepancies among subpopulations may be attributed to genetic diversity, environment, and regional variations in diet and oral hygiene habits [25].
The Egyptian population also showed that type IV was the most prevalent in maxillary second premolars (44.4%), followed by type II (22.2%), with type I being less frequent (16.1%) [11]. These discrepancies across different populations may suggest that genetics plays a significant role in controlling root and canal configurations.
A significant sex effect was observed in RSPM, with females exhibiting a higher prevalence of type III than males (15.4% vs 8.6%), while males showed a higher prevalence of type IV than females (21.4% vs 13.1%). Additionally, type VII and type VI were observed in males but not in females (Table 2). These differences support the idea that maxillary second premolars exhibit considerable anatomical variation in their internal root configurations [11].
Using Ahmed’s classification, the most prevalent canal configuration was 1MP1 in both RSPM (44.0%) and LSPM (49.0%), among all age groups, with no significant difference between these age groups (Table 5). However, sex showed a significant difference on both sides (Table 3). While 2MP B1 P1 and 1MP1-2 are equally the second most prevalent canal configuration in males’ RSPM (15.7%), females showed a higher prevalence of 1MP1-2 (19.2%) and 1MP1-2-1 (15.4%) on the same side. For LSPM, the frequency of 1MP1-2-1 was higher in females than in males (12.3% vs 4.3%), although the prevalence of 2MP B1 P1 and 1MP2-1 was higher in males than in females (14.3% vs 6.2% and 7.1% vs 0.8%, respectively). This aligns with findings by Algarni et al. [26], who also reported sex-related variation in certain Ahmed’s codes on both RSPM and LSPM, with females showing higher frequencies of multi-branching patterns, such as 1MP1-2-1, and males more often exhibiting 1MP1 or 1MP2-1 configurations. In contrast, Watanabe et al. [24] found no significant sex effect. These mixed results suggest that sex-related differences in canal configuration may be population-dependent rather than universal.
In this study, a significant apical level of divergence was observed in the right-side premolars of teeth with Ahmed’s classification 1MP1-2-1-2, with a p-value of <0.001 (Table 6). This is in line with a study by Martins et al. [13] that found that the maxillary second premolar had the highest frequency of merging root canals in the middle third and divergence in the apical third.
The findings of this investigation demonstrated consistent outcomes for the left and right sides across various parameters, highlighting possible anatomical similarities in homonymous teeth, and supporting the notion that symmetry is a universal phenomenon [1]. A previous study [27] involved 1,387 maxillary first premolars and 1,403 maxillary second premolars and found that 80.2% of the maxillary first premolars and 81.8% of the maxillary second premolars showed bilateral symmetry in the number of root canals. Furthermore, the number and shape of root canals in 72.3% of maxillary first premolars and 73.2% of maxillary second premolars displayed bilateral symmetry, underscoring the pervasive symmetry in premolar root and canal morphology. Similarly, Mashyakhy [28] found no significant differences for root number, canal number, and canal configuration between the right and left sides. Age and sex were also considered, as canal morphology can change over time due to secondary dentin deposition, apical maturation, and calcification [29], and may vary between males and females due to X-linked genetic influence [30]. Including these variables broadens the anatomical understanding and supports more informed clinical decision-making.
Utilizing CBCT in this study provided high-quality images, offering more detailed canal configurations compared to conventional radiographs. However, it is considered less accurate than micro-CT, primarily due to its lower spatial resolution and larger voxel size, which limit its ability to capture extremely fine anatomical details, such as accessory canals [31]. While this may be considered a limitation of the study, the lower radiation dose of CBCT compared to micro-CT represents a significant advantage that outweighs this limitation. Another limitation of this study is the uneven distribution of age groups, with some age categories having notably larger sample sizes than others. This imbalance may obscure potential correlations between age and specific canal configurations that are more common in older age groups.
CONCLUSIONS
Maxillary premolars in the Jordanian subpopulation showed a wide range of anatomical variations. The majority of first premolars displayed a two-rooted morphology consistent with Vertucci type IV or Ahmed 2MP1-1 patterns, whereas second premolars were mainly single-rooted, corresponding to Vertucci type I or Ahmed 1MP1. Applying both Vertucci’s and Ahmed’s classification systems in this study provided a more robust assessment of canal morphology, as Ahmed’s detailed coding system captured variations that extended beyond the broader patterns defined by Vertucci. Dental practitioners need to be aware of the various possible configurations of the root and root canal to avoid missing canals, which can lead to treatment failure. Clinicians need to benefit from new radiographic advances, such as CBCT, which can improve diagnosis and treatment planning by providing a useful tool for detecting complex tooth morphology. Ahmed’s classification provided a simplified, detailed canal configuration.
-
CONFLICT OF INTEREST
No potential conflict of interest relevant to this article was reported.
-
FUNDING/SUPPORT
The study was supported by the Deanship of Research at Jordan University of Science and Technology, research award number 2023/161/36.
-
AUTHOR CONTRIBUTIONS
Conceptualization, Methodology, Formal analysis: Ba-Hattab R. Data curation: Ba-Hattab R, Taha NA, Abu Alhaija ES. Investigation: Ba-Hattab R, Shaweesh MM, Taha NA. Funding acquisition, Resources: Taha NA.
Writing - original draft: Ba-Hattab R, Shaweesh MM. Writing - review & editing: all authors. All authors have read and agreed to the published version of the manuscript.
-
DATA SHARING STATEMENT
The datasets used and analyzed during the current study are available from the corresponding author on reasonable request.
Figure 1.

Representative cone-beam computed tomography images in sagittal and axial views (apical, middle, coronal), showcasing various root canal system configurations in maxillary first premolars (MFPM) based on Vertucci’s and Ahmed’s classifications.
Table 1.
Frequency distribution of number of roots and levels of root bifurcations according to sex
| Sex | Number of roots | Bifurcations levela) | ||||||||
|---|---|---|---|---|---|---|---|---|---|---|
| Single root | Double roots | Three roots | Total | Pearson χ2, p-value | Coronal | Middle | Apical | Total | Pearson χ2, p-value | |
| RFPM | ||||||||||
| Male | 19 (27.1) | 50 (71.4) | 1 (1.4) | 70 (100) | 19 (38.0) | 25 (50.0) | 6 (12.0) | 50 (100) | 1.957, 0.418 | |
| Female | 62 (47.7) | 68 (52.3) | 0 (0) | 130 (100) | 9.421, 0.004* | 18 (26.1) | 42 (60.9) | 9 (13.0) | 69 (100) | |
| Total | 81 (40.5) | 118 (59.0) | 1 (0.5) | 200 (100) | 37 (31.1) | 67 (56.3) | 15 (12.6) | 119 (100) | ||
| LFPM | ||||||||||
| Male | 22 (31.4) | 47 (67.1) | 1 (1.4) | 70 (100) | 15 (31.3) | 28 (58.3) | 5 (10.4) | 48 (100) | 0.236, 0.893 | |
| Female | 60 (46.2) | 70 (53.8) | 0 (0) | 130 (100) | 20 (27.8) | 43 (59.7) | 9 (12.5) | 72 (100) | ||
| Total | 82 (41.0) | 117 (58.5) | 1 (0.5) | 200 (100) | 5.639, 0.039* | 35 (29.2) | 71 (59.2) | 14 (11.6) | 120 (100) | |
| RSPM | ||||||||||
| Male | 57 (81.4) | 13 (18.6) | 0 (0) | 70 (100) | 4 (33.3) | 5 (41.7) | 3 (25) | 12 (100) | 2.873, 0.328 | |
| Female | 118 (90.8) | 12 (9.2) | 0 (0) | 130 (100) | 3.630, 0.073 | 1 (9.1) | 4 (36.4) | 6 (54.5) | 11 (100) | |
| Total | 175 (87.5) | 25 (12.5) | 0 (0) | 200 (100) | 5 (21.8) | 9 (39.1) | 9 (39.1) | 25 (100) | ||
| LSPM | ||||||||||
| Male | 59 (84.3) | 10 (14.3) | 1 (1.4) | 70 (100) | 1 (11.1) | 5 (55.6) | 3 (33.3) | 9 (100) | 0.413, 0.850 | |
| Female | 118 (90.8) | 11 (8.5) | 1 (0.8) | 130 (100) | 2 (16.6) | 5 (41.7) | 5 (41.7) | 12 (100) | ||
| Total | 177 (88.5) | 21 (10.5) | 2 (1.0) | 200 (100) | 1.884, 0.367 | 3 (14.3) | 10 (47.6) | 8 (38.1) | 23 (100) | |
Table 2.
Maxillary premolars distribution by sex according to Vertucci’s classification
| Sex | Type I (1) | Type II (2-1) | Type III (1-2-1) | Type IV (2-2) | Type V (1-2) | Type VI (2-1-2) | Type VII (1-2-1-2) | Type VIII (3-3) | Total | Pearson χ2, p-value |
|---|---|---|---|---|---|---|---|---|---|---|
| RFPM | ||||||||||
| Male | 4 (5.7) | 5 (7.1) | 1 (1.4) | 51 (72.9) | 6 (8.6) | 0 (0) | 2 (2.9) | 1 (1.4) | 70 (100) | 8.992, 0.158 |
| Female | 7 (5.4) | 10 (7.7) | 11 (8.5) | 79 (60.8) | 21 (16.2) | 0 (0) | 2 (1.5) | 0 (0) | 130 (100) | |
| Total | 11 (5.5) | 15 (7.5) | 12 (6.0) | 130 (65.0) | 27 (13.5) | 0 (0) | 4 (2.0) | 1 (0.5) | 200 (100) | |
| LFPM | ||||||||||
| Male | 3 (4.3) | 4 (5.7) | 2 (2.9) | 53 (75.7) | 7 (10.0) | 0 (0) | 0 (0) | 1 (1.4) | 70 (100) | 6.693, 0.339 |
| Female | 12 (9.2) | 12 (9.2) | 6 (4.6) | 81 (60.4) | 18 (13.8) | 1 (0.8) | 0 (0) | 0 (0) | 130 (100) | |
| Total | 15 (7.5) | 16 (8.0) | 8 (4.0) | 134 (67.0) | 25 (12.5) | 1 (0.5) | 0 (0) | 1 (0.5) | 200 (100) | |
| RSPM | ||||||||||
| Male | 26 (37.1) | 4 (5.7) | 6 (8.6) | 15 (21.4) | 16 (22.9) | 1 (1.4) | 2 (2.9) | 0 (0) | 70 (100) | 12.981, 0.029* |
| Female | 62 (47.7) | 2 (1.5) | 20 (15.4) | 17 (13.1) | 29 (22.3) | 0 (0) | 0 (0) | 0 (0) | 130 (100) | |
| Total | 88 (44.0) | 6 (3.0) | 26 (13.0) | 32 (16.0) | 45 (22.5) | 1 (0.5) | 2 (1.0) | 0 (0) | 200 (100) | |
| LSPM | ||||||||||
| Male | 30 (42.9) | 5 (7.1) | 3 (4.3) | 11 (15.7) | 17 (24.3) | 2 (2.9) | 1 (1.4) | 1 (1.4) | 70 (100) | 13.075, 0.053 |
| Female | 68 (52.3) | 1 (0.8) | 15 (11.5) | 13 (10.0) | 29 (22.3) | 3 (2.3) | 0 (0) | 1 (0.8) | 130 (100) | |
| Total | 98 (49.0) | 6 (3.0) | 18 (9.0) | 24 (12.0) | 46 (23.0) | 5 (2.5) | 1 (0.5) | 2 (1.0) | 200 (100) |
Table 3.
Maxillary premolars distribution by sex according to Ahmed’s classification
| Sex | 1MP1 | 1MP2-1 | 1MP1-2-1 | 1MP2 | 1MP1-2 | 1MP2-1-2 | 1MP1-2-1-2 | 2MP B1 P1 | 2MP 1B1 P1 | 3MP 1(MB1 DB1) P1 | Total | Pearson χ2, p-value |
|---|---|---|---|---|---|---|---|---|---|---|---|---|
| RFPM | ||||||||||||
| Male | 4 (5.7) | 5 (7.1) | 1 (1.4) | 2 (2.9) | 5 (7.1) | 0 (0) | 2 (2.9) | 49 (70.0) | 1 (1.4) | 1 (1.4) | 70 (100) | 14.016, 0.064 |
| Female | 7 (5.4) | 10 (7.7) | 11 (8.5) | 12 (9.2) | 20 (15.4) | 0 (0) | 2 (1.5) | 67 (51.5) | 1 (0.8) | 0 (0) | 130 (100) | |
| Total | 11 (5.5) | 15 (7.5) | 12 (6.0) | 14 (7.0) | 25 (12.5) | 0 (0) | 4 (2.0) | 116 (58.0) | 2 (1.0) | 1 (0.5) | 200 (100) | |
| LFPM | ||||||||||||
| Male | 3 (4.3) | 4 (5.7) | 2 (2.9) | 5 (7.1) | 8 (11.4) | 0 (0) | 0 (0) | 46 (65.7) | 1 (1.4) | 1 (1.4) | 70 (100) | 7.951, 0.446 |
| Female | 12 (9.2) | 12 (9.2) | 7 (5.4) | 13 (10.0) | 15 (11.5) | 1 (0.8) | 0 (0) | 66 (50.8) | 4 (3.1) | 0 (0) | 130 (100) | |
| Total | 15 (7.5) | 16 (8.0) | 9 (4.5) | 18 (9.0) | 23 (11.5) | 1 (0.5) | 0 (0) | 112 (56.0) | 5 (2.5) | 1 (0.5) | 200 (100) | |
| RSPM | ||||||||||||
| Male | 26 (37.1) | 4 (5.7) | 6 (8.6) | 7 (10.0) | 11 (15.7) | 1 (1.4) | 2 (2.9) | 11 (15.7) | 2 (2.9) | 0 (0) | 70 (100) | 15.341, 0.038* |
| Female | 62 (47.7) | 2 (1.5) | 20 (15.4) | 9 (6.9) | 25 (19.2) | 0 (0) | 0 (0) | 11 (8.5) | 1 (0.8) | 0 (0) | 130 (100) | |
| Total | 88 (44.0) | 6 (3.0) | 26 (13.0) | 16 (8.0) | 36 (18.0) | 1 (0.5) | 2 (1.0) | 22 (11.0) | 3 (1.5) | 0 (0) | 200 (100) | |
| LSPM | ||||||||||||
| Male | 30 (42.9) | 5 (7.1) | 3 (4.3) | 2 (2.9) | 16 (22.9) | 2 (2.9) | 1 (1.4) | 10 (14.3) | 0 (0) | 1 (1.4) | 70 (100) | 17.932, 0.023* |
| Female | 68 (52.3) | 1 (0.8) | 16 (12.3) | 6 (4.6) | 24 (18.5) | 3 (2.3) | 0 (0) | 8 (6.2) | 3 (2.3) | 1 (0.8) | 130 (100) | |
| Total | 98 (49.0) | 6 (3.0) | 19 (9.5) | 8 (4.0) | 40 (20.0) | 5 (2.5) | 1 (0.5) | 18 (9.0) | 3 (1.5) | 2 (1.0) | 200 (100) |
Table 4.
Maxillary premolars distribution by age according to Vertucci’s classification
Table 5.
Maxillary premolars distribution by age according to Ahmed’s classification
Table 6.
ANOVA and independent t-test to compare the levels of merging and divergence of canals (mm)
| Variable | 1MP2-1 Level of merging | 1MP1-2 Level of divergence | 1MP2-1-2 Level of merging/divergence | 1MP1-2-1 Level of divergence/merging | 1MP1-2-1-2 Level of divergence/merging/divergence |
|---|---|---|---|---|---|
| RFPM | 5.78 ± 0.922 (middle) | 6.27 ± 1.35 (apical) | 4.81 ± 1.44/8.81 ± 1.46 (middle/apical) | 4.81 ± 1.44/8.81 ± 1.46 (middle/apical) | 4.03 ± 0.577/7.49 ± 0.12/8.46 ± 0.11 (coronal/middle/apical) |
| LFPM | 5.76 ± 1.270 (middle) | 6.52 ± 1.12 (apical) | 4.43 ± 1.22/7.72 ± 1.78 (middle/apical) | 4.43 ± 1.22/7.72 ± 1.78 (middle/apical) | - |
| RSPM | 8.03 ± 1.616 (apical) | 5.47 ± 1.68 (middle) | 5.11 ± 1.56/8.10 ± 1.42 (middle/apical) | 5.11 ± 1.56/8.10 ± 1.42 (middle/apical) | 5.84 ± 0.586/7.93 ± 0.04/9.36 ± 1.29 (coronal/middle/apical) |
| LSPM | 7.95 ± 0.924 (apical) | 4.98 ± 1.74 (middle) | 4.09 ± 1.00/7.34 ± 1.54 (middle/apical) | 4.09 ± 1.00/7.34 ± 1.54 (middle/apical) | - |
| p-value | 0.945 | 0.182 | 0.126/0.078 | 0.126/0.078 | 0.972/0.299/<0.001a),* |
- 1. Xu M, Ren H, Liu C, Zhao X, Li X. Systematic review and meta-analysis of root morphology and canal configuration of permanent premolars using cone-beam computed tomography. BMC Oral Health 2024;24:656.ArticlePubMedPMCPDF
- 2. Vertucci FJ. Root canal morphology and its relationship to endodontic procedures. Endod Topics 2005;10:3-29.Article
- 3. Weine F. Endodontic therapy. 6th ed. St. Louis: Mosby; 2003. pp. 106-110.
- 4. Vertucci FJ. Root canal anatomy of the human permanent teeth. Oral Surg Oral Med Oral Pathol 1984;58:589-599.ArticlePubMed
- 5. Ahmed HM, Versiani MA, De-Deus G, Dummer PM. A new system for classifying root and root canal morphology. Int Endod J 2017;50:761-770.ArticlePubMedPDF
- 6. Awawdeh L, Abdullah H, Al-Qudah A. Root form and canal morphology of Jordanian maxillary first premolars. J Endod 2008;34:956-961.ArticlePubMed
- 7. Al-Ghananeem MM, Haddadin K, Al-Khreisat AS, Al-Weshah M, Al-Habahbeh N. The number of roots and canals in the maxillary second premolars in a group of Jordanian population. Int J Dent 2014;2014:797692.ArticlePubMedPMCPDF
- 8. Patel S, Dawood A, Whaites E, Pitt Ford T. New dimensions in endodontic imaging: part 1: conventional and alternative radiographic systems. Int Endod J 2009;42:447-462.ArticlePubMed
- 9. Almeida JC, Candemil AP, Bertolini GR, Souza-Gabriel AE, Cruz-Filho AM, Sousa-Neto MD, et al. Cone-beam computed tomographic evaluation of the root canal anatomy of the lower premolars and molars in a Brazilian sub-population. Imaging Sci Dent 2023;53:77-82.ArticlePubMedPMCPDF
- 10. Jung YH, Hwang JJ, Lee JS, Cho BH. Analysis of root number and canal morphology of maxillary premolars using cone-beam computed tomography. Imaging Sci Dent 2024;54:370-380.ArticlePubMedPMCPDF
- 11. Saber SE, Ahmed MH, Obeid M, Ahmed HM. Root and canal morphology of maxillary premolar teeth in an Egyptian subpopulation using two classification systems: a cone beam computed tomography study. Int Endod J 2019;52:267-278.ArticlePubMedPDF
- 12. von Elm E, Altman DG, Egger M, Pocock SJ, Gøtzsche PC, Vandenbroucke JP. The Strengthening the Reporting of Observational Studies in Epidemiology (STROBE) statement: guidelines for reporting observational studies. Lancet 2007;370:1453-1457.ArticlePubMed
- 13. Martins JN, Marques D, Mata A, Caramês J. Root and root canal morphology of the permanent dentition in a Caucasian population: a cone-beam computed tomography study. Int Endod J 2017;50:1013-1026.ArticlePubMedPDF
- 14. Yang L, Han J, Wang Q, Wang Z, Yu X, Du Y. Variations of root and canal morphology of mandibular second molars in Chinese individuals: a cone-beam computed tomography study. BMC Oral Health 2022;22:274.ArticlePubMedPMCPDF
- 15. Iqbal A. The factors responsible for endodontic treatment failure in the permanent dentitions of the patients reported to the College of Dentistry, the University of Aljouf, Kingdom of Saudi Arabia. J Clin Diagn Res 2016;10:ZC146-ZC148.ArticlePubMedPMC
- 16. Shukla S, Chug A, Afrashtehfar KI. Role of cone beam computed tomography in diagnosis and treatment planning in dentistry: an update. J Int Soc Prev Community Dent 2017;7(Suppl 3):S125-S136.ArticlePubMedPMC
- 17. G K, Singh N, Yadav R, Duhan J, Tewari S, Gupta A, et al. Comparative analysis of the accuracy of periapical radiography and cone-beam computed tomography for diagnosing complex endodontic pathoses using a gold standard reference: a prospective clinical study. Int Endod J 2021;54:1448-1461.ArticlePubMedPDF
- 18. de Toubes KM, Côrtes MI, Valadares MA, Fonseca LC, Nunes E, Silveira FF. Comparative analysis of accessory mesial canal identification in mandibular first molars by using four different diagnostic methods. J Endod 2012;38:436-441.ArticlePubMed
- 19. Buchanan GD, Gamieldien MY, Tredoux S, Vally ZI. Root and canal configurations of maxillary premolars in a South African subpopulation using cone beam computed tomography and two classification systems. J Oral Sci 2020;62:93-97.ArticlePubMed
- 20. Al-Zubaidi SM, Almansour MI, Al Mansour NN, Alshammari AS, Alshammari AF, Altamimi YS, et al. Assessment of root morphology and canal configuration of maxillary premolars in a Saudi subpopulation: a cone-beam computed tomographic study. BMC Oral Health 2021;21:397.ArticlePubMedPMC
- 21. Olczak K, Pawlicka H, Szymański W. Root form and canal anatomy of maxillary first premolars: a cone-beam computed tomography study. Odontology 2022;110:365-375.ArticlePubMedPDF
- 22. Albuquerque D, Kottoor J, Hammo M. Endodontic and clinical considerations in the management of variable anatomy in mandibular premolars: a literature review. Biomed Res Int 2014;2014:512574.ArticlePubMedPMCPDF
- 23. Aguilera J, Vallette M, Navarro P, Betancourt P. Root and root canal system morphology of maxillary first premolars in a Chilean subpopulation: a cone-beam computed tomography study. Int J Morphol 2022;40:449-454.Article
- 24. Watanabe S, Yabumoto S, Okiji T. Evaluation of root and root canal morphology in maxillary premolar teeth: a cone-beam computed tomography study using two classification systems in a Japanese population. J Dent Sci 2025;20:927-935.ArticlePubMed
- 25. Mustafa M, Batul R, Karobari MI, Alamri HM, Abdulwahed A, Almokhatieb AA, et al. Assessment of the root and canal morphology in the permanent dentition of Saudi Arabian population using cone beam computed and micro-computed tomography: a systematic review. BMC Oral Health 2024;24:343.ArticlePubMedPMCPDF
- 26. Algarni HA, Alonazi MA, Arshad H, Zahra F, Umer F, Maqbool I, et al. Comprehensive analysis of root canal morphology in maxillary premolars among the Pakistani subpopulation: a CBCT-based study. Eur J Med Res 2024;29:391.ArticlePubMedPMCPDF
- 27. Li YH, Bao SJ, Yang XW, Tian XM, Wei B, Zheng YL. Symmetry of root anatomy and root canal morphology in maxillary premolars analyzed using cone-beam computed tomography. Arch Oral Biol 2018;94:84-92.ArticlePubMed
- 28. Mashyakhy M. Anatomical evaluation of maxillary premolars in a Saudi population: an in vivo cone-beam computed tomography study. J Contemp Dent Pract 2021;22:284-289.ArticlePubMed
- 29. Karobari MI, Iqbal A, Batul R, Adil AH, Syed J, Algarni HA, et al. Exploring age and gender variations in root canal morphology of maxillary premolars in Saudi sub population: a cross-sectional CBCT study. BMC Oral Health 2024;24:543.ArticlePubMedPMCPDF
- 30. Martins JN, Marques D, Francisco H, Caramês J. Gender influence on the number of roots and root canal system configuration in human permanent teeth of a Portuguese subpopulation. Quintessence Int 2018;49:103-111.ArticlePubMed
- 31. Paes da Silva Ramos Fernandes LM, Rice D, Ordinola-Zapata R, Alvares Capelozza AL, Bramante CM, Jaramillo D, et al. Detection of various anatomic patterns of root canals in mandibular incisors using digital periapical radiography, 3 cone-beam computed tomographic scanners, and micro-computed tomographic imaging. J Endod 2014;40:42-45.ArticlePubMed
REFERENCES
Tables & Figures
REFERENCES
Citations
Citations to this article as recorded by 
 ePub Link
 Cite
CiteCone-beam computed tomography analysis of maxillary premolar canal anatomy: Ahmed’s versus Vertucci’s classifications in a Jordanian cohort
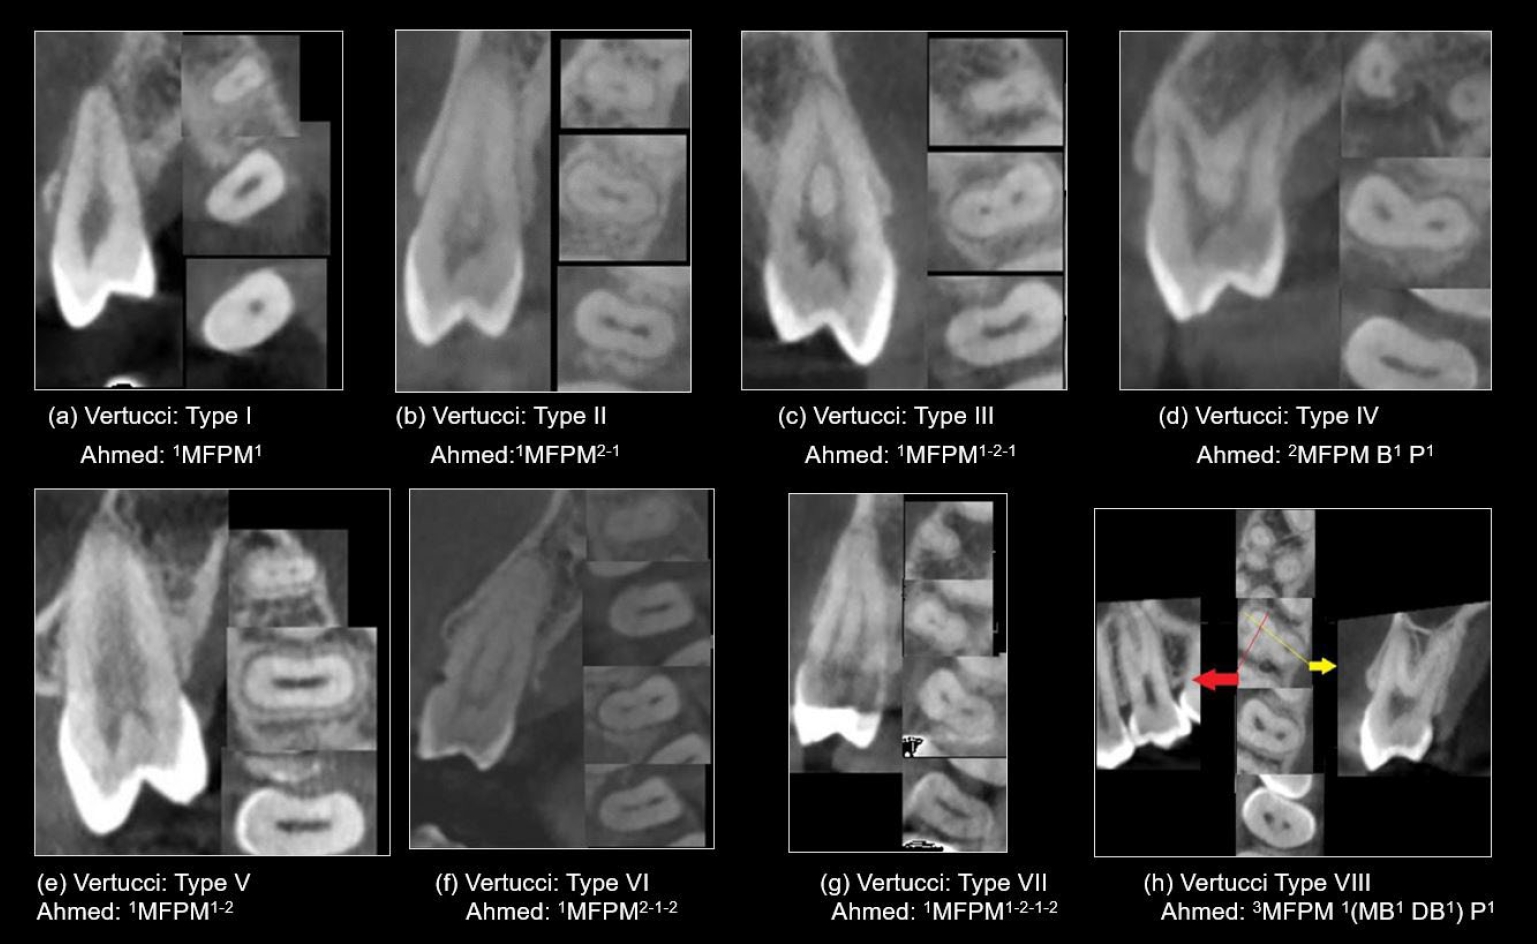
Figure 1. Representative cone-beam computed tomography images in sagittal and axial views (apical, middle, coronal), showcasing various root canal system configurations in maxillary first premolars (MFPM) based on Vertucci’s and Ahmed’s classifications.
Figure 1.
Cone-beam computed tomography analysis of maxillary premolar canal anatomy: Ahmed’s versus Vertucci’s classifications in a Jordanian cohort
| Sex | Number of roots | Bifurcations level |
||||||||
|---|---|---|---|---|---|---|---|---|---|---|
| Single root | Double roots | Three roots | Total | Pearson χ2, p-value | Coronal | Middle | Apical | Total | Pearson χ2, p-value | |
| RFPM | ||||||||||
| Male | 19 (27.1) | 50 (71.4) | 1 (1.4) | 70 (100) | 19 (38.0) | 25 (50.0) | 6 (12.0) | 50 (100) | 1.957, 0.418 | |
| Female | 62 (47.7) | 68 (52.3) | 0 (0) | 130 (100) | 9.421, 0.004 |
18 (26.1) | 42 (60.9) | 9 (13.0) | 69 (100) | |
| Total | 81 (40.5) | 118 (59.0) | 1 (0.5) | 200 (100) | 37 (31.1) | 67 (56.3) | 15 (12.6) | 119 (100) | ||
| LFPM | ||||||||||
| Male | 22 (31.4) | 47 (67.1) | 1 (1.4) | 70 (100) | 15 (31.3) | 28 (58.3) | 5 (10.4) | 48 (100) | 0.236, 0.893 | |
| Female | 60 (46.2) | 70 (53.8) | 0 (0) | 130 (100) | 20 (27.8) | 43 (59.7) | 9 (12.5) | 72 (100) | ||
| Total | 82 (41.0) | 117 (58.5) | 1 (0.5) | 200 (100) | 5.639, 0.039 |
35 (29.2) | 71 (59.2) | 14 (11.6) | 120 (100) | |
| RSPM | ||||||||||
| Male | 57 (81.4) | 13 (18.6) | 0 (0) | 70 (100) | 4 (33.3) | 5 (41.7) | 3 (25) | 12 (100) | 2.873, 0.328 | |
| Female | 118 (90.8) | 12 (9.2) | 0 (0) | 130 (100) | 3.630, 0.073 | 1 (9.1) | 4 (36.4) | 6 (54.5) | 11 (100) | |
| Total | 175 (87.5) | 25 (12.5) | 0 (0) | 200 (100) | 5 (21.8) | 9 (39.1) | 9 (39.1) | 25 (100) | ||
| LSPM | ||||||||||
| Male | 59 (84.3) | 10 (14.3) | 1 (1.4) | 70 (100) | 1 (11.1) | 5 (55.6) | 3 (33.3) | 9 (100) | 0.413, 0.850 | |
| Female | 118 (90.8) | 11 (8.5) | 1 (0.8) | 130 (100) | 2 (16.6) | 5 (41.7) | 5 (41.7) | 12 (100) | ||
| Total | 177 (88.5) | 21 (10.5) | 2 (1.0) | 200 (100) | 1.884, 0.367 | 3 (14.3) | 10 (47.6) | 8 (38.1) | 23 (100) | |
| Sex | Type I (1) | Type II (2-1) | Type III (1-2-1) | Type IV (2-2) | Type V (1-2) | Type VI (2-1-2) | Type VII (1-2-1-2) | Type VIII (3-3) | Total | Pearson χ2, p-value |
|---|---|---|---|---|---|---|---|---|---|---|
| RFPM | ||||||||||
| Male | 4 (5.7) | 5 (7.1) | 1 (1.4) | 51 (72.9) | 6 (8.6) | 0 (0) | 2 (2.9) | 1 (1.4) | 70 (100) | 8.992, 0.158 |
| Female | 7 (5.4) | 10 (7.7) | 11 (8.5) | 79 (60.8) | 21 (16.2) | 0 (0) | 2 (1.5) | 0 (0) | 130 (100) | |
| Total | 11 (5.5) | 15 (7.5) | 12 (6.0) | 130 (65.0) | 27 (13.5) | 0 (0) | 4 (2.0) | 1 (0.5) | 200 (100) | |
| LFPM | ||||||||||
| Male | 3 (4.3) | 4 (5.7) | 2 (2.9) | 53 (75.7) | 7 (10.0) | 0 (0) | 0 (0) | 1 (1.4) | 70 (100) | 6.693, 0.339 |
| Female | 12 (9.2) | 12 (9.2) | 6 (4.6) | 81 (60.4) | 18 (13.8) | 1 (0.8) | 0 (0) | 0 (0) | 130 (100) | |
| Total | 15 (7.5) | 16 (8.0) | 8 (4.0) | 134 (67.0) | 25 (12.5) | 1 (0.5) | 0 (0) | 1 (0.5) | 200 (100) | |
| RSPM | ||||||||||
| Male | 26 (37.1) | 4 (5.7) | 6 (8.6) | 15 (21.4) | 16 (22.9) | 1 (1.4) | 2 (2.9) | 0 (0) | 70 (100) | 12.981, 0.029 |
| Female | 62 (47.7) | 2 (1.5) | 20 (15.4) | 17 (13.1) | 29 (22.3) | 0 (0) | 0 (0) | 0 (0) | 130 (100) | |
| Total | 88 (44.0) | 6 (3.0) | 26 (13.0) | 32 (16.0) | 45 (22.5) | 1 (0.5) | 2 (1.0) | 0 (0) | 200 (100) | |
| LSPM | ||||||||||
| Male | 30 (42.9) | 5 (7.1) | 3 (4.3) | 11 (15.7) | 17 (24.3) | 2 (2.9) | 1 (1.4) | 1 (1.4) | 70 (100) | 13.075, 0.053 |
| Female | 68 (52.3) | 1 (0.8) | 15 (11.5) | 13 (10.0) | 29 (22.3) | 3 (2.3) | 0 (0) | 1 (0.8) | 130 (100) | |
| Total | 98 (49.0) | 6 (3.0) | 18 (9.0) | 24 (12.0) | 46 (23.0) | 5 (2.5) | 1 (0.5) | 2 (1.0) | 200 (100) |
| Sex | 1MP1 | 1MP2-1 | 1MP1-2-1 | 1MP2 | 1MP1-2 | 1MP2-1-2 | 1MP1-2-1-2 | 2MP B1 P1 | 2MP 1B1 P1 | 3MP 1(MB1 DB1) P1 | Total | Pearson χ2, p-value |
|---|---|---|---|---|---|---|---|---|---|---|---|---|
| RFPM | ||||||||||||
| Male | 4 (5.7) | 5 (7.1) | 1 (1.4) | 2 (2.9) | 5 (7.1) | 0 (0) | 2 (2.9) | 49 (70.0) | 1 (1.4) | 1 (1.4) | 70 (100) | 14.016, 0.064 |
| Female | 7 (5.4) | 10 (7.7) | 11 (8.5) | 12 (9.2) | 20 (15.4) | 0 (0) | 2 (1.5) | 67 (51.5) | 1 (0.8) | 0 (0) | 130 (100) | |
| Total | 11 (5.5) | 15 (7.5) | 12 (6.0) | 14 (7.0) | 25 (12.5) | 0 (0) | 4 (2.0) | 116 (58.0) | 2 (1.0) | 1 (0.5) | 200 (100) | |
| LFPM | ||||||||||||
| Male | 3 (4.3) | 4 (5.7) | 2 (2.9) | 5 (7.1) | 8 (11.4) | 0 (0) | 0 (0) | 46 (65.7) | 1 (1.4) | 1 (1.4) | 70 (100) | 7.951, 0.446 |
| Female | 12 (9.2) | 12 (9.2) | 7 (5.4) | 13 (10.0) | 15 (11.5) | 1 (0.8) | 0 (0) | 66 (50.8) | 4 (3.1) | 0 (0) | 130 (100) | |
| Total | 15 (7.5) | 16 (8.0) | 9 (4.5) | 18 (9.0) | 23 (11.5) | 1 (0.5) | 0 (0) | 112 (56.0) | 5 (2.5) | 1 (0.5) | 200 (100) | |
| RSPM | ||||||||||||
| Male | 26 (37.1) | 4 (5.7) | 6 (8.6) | 7 (10.0) | 11 (15.7) | 1 (1.4) | 2 (2.9) | 11 (15.7) | 2 (2.9) | 0 (0) | 70 (100) | 15.341, 0.038 |
| Female | 62 (47.7) | 2 (1.5) | 20 (15.4) | 9 (6.9) | 25 (19.2) | 0 (0) | 0 (0) | 11 (8.5) | 1 (0.8) | 0 (0) | 130 (100) | |
| Total | 88 (44.0) | 6 (3.0) | 26 (13.0) | 16 (8.0) | 36 (18.0) | 1 (0.5) | 2 (1.0) | 22 (11.0) | 3 (1.5) | 0 (0) | 200 (100) | |
| LSPM | ||||||||||||
| Male | 30 (42.9) | 5 (7.1) | 3 (4.3) | 2 (2.9) | 16 (22.9) | 2 (2.9) | 1 (1.4) | 10 (14.3) | 0 (0) | 1 (1.4) | 70 (100) | 17.932, 0.023 |
| Female | 68 (52.3) | 1 (0.8) | 16 (12.3) | 6 (4.6) | 24 (18.5) | 3 (2.3) | 0 (0) | 8 (6.2) | 3 (2.3) | 1 (0.8) | 130 (100) | |
| Total | 98 (49.0) | 6 (3.0) | 19 (9.5) | 8 (4.0) | 40 (20.0) | 5 (2.5) | 1 (0.5) | 18 (9.0) | 3 (1.5) | 2 (1.0) | 200 (100) |
| Age (yr) | Type I (1-1) | Type II (2-1) | Type III (1-2-1) | Type IV (2-2) | Type V (1-2) | Type VI (2-1-2) | Type VII (1-2-1-2) | Type VIII (3-3) | Total | Pearson χ2, p-value |
|---|---|---|---|---|---|---|---|---|---|---|
| RFPM | ||||||||||
| 13–24 | 6 (4.5) | 7 (5.2) | 10 (7.5) | 89 (66.4) | 18 (13.4) | 0 (0) | 4 (3.0) | 0 (0) | 134 (100) | 19.179, 0.742 |
| 25–34 | 3 (6.8) | 5 (11.4) | 1 (2.3) | 28 (63.6) | 6 (13.6) | 0 (0) | 0 (0) | 1 (2.3) | 44 (100) | |
| 35–44 | 1 (8.3) | 2 (16.7) | 0 (0) | 8 (66.7) | 1 (8.3) | 0 (0) | 0 (0) | 0 (0) | 12 (100) | |
| 45–54 | 1 (14.3) | 0 (0) | 1 (14.3) | 3 (42.9) | 2 (28.6) | 0 (0) | 0 (0) | 0 (0) | 7 (100) | |
| ≥55 | 0 (0) | 1 (33.3) | 0 (0) | 2 (66.7) | 0 (0) | 0 (0) | 0 (0) | 0 (0) | 3 (100) | |
| Total | 11 (5.5) | 15 (7.5) | 12 (6.0) | 130 (65.0) | 27 (13.5) | 0 (0) | 4 (2.0) | 1 (0.5) | 200 (100) | |
| LFPM | ||||||||||
| 13–24 | 10 (7.5) | 9 (6.7) | 5 (3.7) | 87 (64.9) | 21 (15.7) | 0 (0) | 1 (0.7) | 1 (0.7) | 134 (100) | 15.846, 0.894 |
| 25–34 | 2 (4.5) | 4 (9.1) | 3 (6.8) | 33 (75.0) | 2 (4.5) | 0 (0) | 0 (0) | 0 (0) | 44 (100) | |
| 35–44 | 1 (8.3) | 1 (8.3) | 0 (0) | 9 (75.0) | 1 (8.3) | 0 (0) | 0 (0) | 0 (0) | 12 (100) | |
| 45–54 | 2 (28.6) | 1 (14.3) | 0 (0) | 3 (42.9) | 1 (14.3) | 0 (0) | 0 (0) | 0 (0) | 7 (100) | |
| ≥55 | 0 (0) | 1 (33.3) | 0 (0) | 2 (66.7) | 0 (0) | 0 (0) | 0 (0) | 0 (0) | 3 (100) | |
| Total | 15 (7.5) | 16 (8.0) | 8 (4.0) | 134 (67.0) | 25 (12.5) | 0 (0) | 1 (0.5) | 1 (0.5) | 200 (100) | |
| RSPM | ||||||||||
| 13–24 | 58 (43.3) | 0 (0) | 16 (11.9) | 25 (18.7) | 32 (23.9) | 1 (0.7) | 2 (1.5) | 0 (0) | 134 (100) | 23.953, 0.465 |
| 25–34 | 18 (40.9) | 4 (9.1) | 8 (18.2) | 6 (13.6) | 8 (18.2) | 0 (0) | 0 (0) | 0 (0) | 44 (100) | |
| 35–44 | 6 (50.0) | 1 (8.3) | 1 (8.3) | 0 (0) | 4 (33.3) | 0 (0) | 0 (0) | 0 (0) | 12 (100) | |
| 45–54 | 4 (57.1) | 1 (14.3) | 1 (14.3) | 0 (0) | 1 (14.3) | 0 (0) | 0 (0) | 0 (0) | 7 (100) | |
| ≥55 | 2 (66.7) | 0 (0) | 0 (0) | 1 (33.3) | 0 (0) | 0 (0) | 0 (0) | 0 (0) | 3 (100) | |
| Total | 88 (44.0) | 6 (3.0) | 26 (13.0) | 32 (16.0) | 45 (22.5) | 1 (0.5) | 2 (1) | 0 (0) | 200 (100) | |
| LSPM | ||||||||||
| 13–24 | 67 (50.0) | 2 (1.5) | 10 (7.5) | 19 (14.2) | 34 (25.4) | 1 (0.7) | 0 (0) | 1 (0.7) | 134 (100) | 41.246, 0.051 |
| 25–34 | 22 (50.0) | 3 (6.8) | 4 (9.1) | 4 (9.1) | 7 (15.9) | 2 (4.5) | 1 (2.3) | 1 (2.3) | 44 (100) | |
| 35–44 | 4 (33.3) | 0 (0) | 3 (25.0) | 0 (0) | 3 (25.0) | 2 (16.7) | 0 (0) | 0 (0) | 12 (100) | |
| 45–54 | 4 (57.1) | 0 (0) | 1 (14.3) | 0 (0) | 2 (28.6) | 0 (0) | 0 (0) | 0 (0) | 7 (100) | |
| ≥55 | 1 (33.3) | 1 (33.3) | 0 | 1 (33.3) | 0 (0) | 0 (0) | 0 (0) | 0 (0) | 3 (100) | |
| Total | 98 (49.0) | 6 (3.0) | 18 (9.0) | 24 (12.0) | 46 (23.0) | 5 (2.5) | 1 (0.5) | 2 (1) | 200 (100) |
| Age (yr) | 1MP1 | 1MP2-1 | 1MP1-2-1 | 1MP2 | 1MP1-2 | 1MP2-1-2 | 1MP1-2-1-2 | 2MP B1 P1 | 2MP 1B1 P1 | 3MP 1(MB1 DB1) P1 | Total | Pearson χ2, p-value |
|---|---|---|---|---|---|---|---|---|---|---|---|---|
| RFPM | ||||||||||||
| 13–24 | 6 (4.5) | 7 (5.2) | 10 (7.5) | 11 (8.2) | 18 (13.4) | 0 (0) | 4 (3.0) | 77 (57.5) | 1 (0.7) | 0 (0) | 134 (100) | 31.991, 0.467 |
| 25–34 | 3 (6.8) | 5 (11.4) | 1 (2.3) | 1 (2.3) | 5 (11.4) | 0 (0) | 0 (0) | 28 (63.6) | 0 (0) | 1 (2.3) | 44 (100) | |
| 35–44 | 1 (8.3) | 2 (16.7) | 0 (0) | 2 (16.7) | 0 (0) | 0 (0) | 0 (0) | 6 (50.0) | 1 (8.3) | 0 (0) | 12 (100) | |
| 45–54 | 1 (14.3) | 0 (0) | 1 (14.3) | 0 (0) | 2 (28.6) | 0 (0) | 0 (0) | 3 (42.9) | 0 (0) | 0 (0) | 7 (100) | |
| ≥55 | 0 (0) | 1 (33.3) | 0 (0) | 0 (0) | 0 (0) | 0 (0) | 0 (0) | 2 (66.7) | 0 (0) | 0 (0) | 3 (100) | |
| Total | 11 (5.5) | 15 (7.5) | 12 (6.0) | 14 (7.0) | 25 (12.5) | 0 (0) | 4 (2.0) | 116 (58.0) | 2 (1.0) | 1 (0.5) | 200 (100) | |
| LFPM | ||||||||||||
| 13–24 | 10 (7.5) | 8 (6.0) | 6 (4.5) | 8 (6) | 20 (14.9) | 0 (0) | 1 (0.7) | 76 (56.7) | 4 (3.0) | 1 (0.7) | 134 (100) | 31.261, 0.504 |
| 25–34 | 2 (4.5) | 5 (11.4) | 3 (6.8) | 5 (11.4) | 2 (4.5) | 0 (0) | 0 (0) | 27 (61.4) | 0 (0) | 0 (0) | 44 (100) | |
| 35–44 | 1 (8.3) | 1 (8.3) | 0 (0) | 4 (33.3) | 0 (0) | 0 (0) | 0 (0) | 5 (41.7) | 1 (8.3) | 0 (0) | 12 (100) | |
| 45–54 | 2 (28.6) | 1 (14.3) | 0 (0) | 1 (14.3) | 1 (14.3) | 0 (0) | 0 (0) | 2 (28.6) | 0 (0) | 0 (0) | 7 (100) | |
| ≥55 | 0 (0) | 1 (33.3) | 0 (0) | 0 (0) | 0 (0) | 0 (0) | 0 (0) | 2 (66.7) | 0 (0) | 0 (0) | 3 (100) | |
| Total | 15 (7.5) | 16 (8.0) | 9 (4.5) | 18 (9.0) | 23 (11.5) | 0 (0) | 1 (0.5) | 112 (56.0) | 5 (2.5) | 1 (0.5) | 200 (100) | |
| RSPM | ||||||||||||
| 13–24 | 58 (43.3) | 0 (0) | 16 (11.9) | 12 (9.0) | 26 (19.4) | 0 (0) | 1 (0.7) | 2 (1.5) | 17 (12.7) | 2 (1.5) | 134 (100) | 24.609, 0.822 |
| 25–34 | 18 (40.9) | 4 (9.1) | 8 (18.2) | 3 (6.8) | 6 (13.6) | 0 (0) | 0 (0) | 0 (0) | 4 (9.1) | 1 (2.3) | 44 (100) | |
| 35–44 | 6 (50.0) | 1 (8.3) | 1 (8.3) | 1 (8.3) | 3 (25.0) | 0 (0) | 0 (0) | 0 (0) | 0 (0) | 0 (0) | 12 (100) | |
| 45–54 | 4 (57.1) | 1 (14.3) | 1 (14.3) | 0 | 1 (14.3) | 0 (0) | 0 (0) | 0 (0) | 0 (0) | 0 (0) | 7 (100) | |
| ≥55 | 2 (66.7) | 0 (0) | 0 (0) | 0 (0) | 0 (0) | 0 (0) | 0 (0) | 0 (0) | 1 (33.3) | 0 (0) | 3 (100) | |
| Total | 88 (44.0) | 6 (3.0) | 26 (13.0) | 16 (8.0) | 36 (18.0) | 0 (0) | 1 (0.5) | 2 (1.0) | 22 (11.0) | 3 (1.5) | 200 (100) | |
| LSPM | ||||||||||||
| 13–24 | 67 (50.0) | 2 (1.5) | 11 (8.2) | 5 (3.7) | 28 (20.9) | 1 (0.7) | 0 (0) | 16 (11.9) | 3 (2.2) | 1 (0.7) | 134 (100) | 48.785, 0.076 |
| 25–34 | 22 (50.0) | 3 (6.8) | 4 (9.1) | 2 (4.5) | 7 (15.9) | 2 (4.5) | 1 (2.3) | 2 (4.5) | 0 (0) | 1 (2.3) | 44 (100) | |
| 35–44 | 4 (33.3) | 0 (0) | 3 (25.0) | 0 (0) | 3 (25.0) | 2 (16.7) | 0 (0) | 0 (0) | 0 (0) | 0 (0) | 12 (100) | |
| 45–54 | 4 (57.1) | 0 (0) | 1 (14.3) | 0 (0) | 2 (28.6) | 0 (0) | 0 (0) | 0 (0) | 0 (0) | 0 (0) | 7 (100) | |
| ≥55 | 1 (33.3) | 1 (33.3) | 0 (0) | 1 (33.3) | 0 (0) | 0 (0) | 0 (0) | 0 (0) | 0 (0) | 0 (0) | 3 (100) | |
| Total | 98 (49.0) | 6 (3.0) | 19 (9.5) | 8 (4.0) | 40 (20.0) | 5 (2.5) | 1 (0.5) | 18 (9.0) | 3 (1.5) | 2 (1.0) | 200 (100) |
| Variable | 1MP2-1 Level of merging | 1MP1-2 Level of divergence | 1MP2-1-2 Level of merging/divergence | 1MP1-2-1 Level of divergence/merging | 1MP1-2-1-2 Level of divergence/merging/divergence |
|---|---|---|---|---|---|
| RFPM | 5.78 ± 0.922 (middle) | 6.27 ± 1.35 (apical) | 4.81 ± 1.44/8.81 ± 1.46 (middle/apical) | 4.81 ± 1.44/8.81 ± 1.46 (middle/apical) | 4.03 ± 0.577/7.49 ± 0.12/8.46 ± 0.11 (coronal/middle/apical) |
| LFPM | 5.76 ± 1.270 (middle) | 6.52 ± 1.12 (apical) | 4.43 ± 1.22/7.72 ± 1.78 (middle/apical) | 4.43 ± 1.22/7.72 ± 1.78 (middle/apical) | - |
| RSPM | 8.03 ± 1.616 (apical) | 5.47 ± 1.68 (middle) | 5.11 ± 1.56/8.10 ± 1.42 (middle/apical) | 5.11 ± 1.56/8.10 ± 1.42 (middle/apical) | 5.84 ± 0.586/7.93 ± 0.04/9.36 ± 1.29 (coronal/middle/apical) |
| LSPM | 7.95 ± 0.924 (apical) | 4.98 ± 1.74 (middle) | 4.09 ± 1.00/7.34 ± 1.54 (middle/apical) | 4.09 ± 1.00/7.34 ± 1.54 (middle/apical) | - |
| p-value | 0.945 | 0.182 | 0.126/0.078 | 0.126/0.078 | 0.972/0.299/<0.001 |
Table 1. Frequency distribution of number of roots and levels of root bifurcations according to sex
Values are presented as number (%). RFPM, right maxillary first premolar; LFPM, left maxillary first premolar; RSPM, right maxillary second premolar; LSPM, left maxillary second premolar. Calculated among teeth with ≥2 roots only.
Table 2. Maxillary premolars distribution by sex according to Vertucci’s classification
Values are presented as number (%). RFPM, right maxillary first premolar; LFPM, left maxillary first premolar; RSPM, right maxillary second premolar; LSPM, left maxillary second premolar.
Table 3. Maxillary premolars distribution by sex according to Ahmed’s classification
Values are presented as number (%). RFPM, right maxillary first premolar; LFPM, left maxillary first premolar; RSPM, right maxillary second premolar; LSPM, left maxillary second premolar.
Table 4. Maxillary premolars distribution by age according to Vertucci’s classification
Values are presented as number (%). RFPM, right maxillary first premolar; LFPM, left maxillary first premolar; RSPM, right maxillary second premolar; LSPM, left maxillary second premolar.
Table 5. Maxillary premolars distribution by age according to Ahmed’s classification
Values are presented as number (%). RFPM, right maxillary first premolar; LFPM, left maxillary first premolar; RSPM, right maxillary second premolar; LSPM, left maxillary second premolar.
Table 6. ANOVA and independent t-test to compare the levels of merging and divergence of canals (mm)
Values are presented as mean ± standard deviation (mm). ANOVA, analysis of variance; RFPM, right maxillary first premolar; LFPM, left maxillary first premolar; RSPM, right maxillary second premolar; LSPM, left maxillary second premolar. Independent

