Warning: mkdir(): Permission denied in /home/virtual/lib/view_data.php on line 81

Warning: fopen(upload/ip_log/ip_log_2024-12.txt): failed to open stream: No such file or directory in /home/virtual/lib/view_data.php on line 83

Warning: fwrite() expects parameter 1 to be resource, boolean given in /home/virtual/lib/view_data.php on line 84
Interplay of collagen and mast cells in periapical granulomas and periapical cysts: a comparative polarizing microscopic and immunohistochemical study
Skip Navigation
Skip to contents

Restor Dent Endod : Restorative Dentistry & Endodontics

OPEN ACCESS

Articles

Page Path
HOME > Restor Dent Endod > Volume 47(1); 2022 > Article
Research Article Interplay of collagen and mast cells in periapical granulomas and periapical cysts: a comparative polarizing microscopic and immunohistochemical study
Deepty Bansal1orcid, Mala Kamboj1orcid, Anjali Narwal1orcid, Anju Devi1orcid, Nisha Marwah2

DOI: https://doi.org/10.5395/rde.2022.47.e12
Published online: February 14, 2022

1Department of Oral and Maxillofacial Pathology and Microbiology, Post Graduate Institute of Dental Sciences, Pt B.D. Sharma University of Health Sciences, Rohtak, India.

2Department of Pathology, Post Graduate Institute of Medical Sciences, Pt B.D. Sharma University of Health Sciences, Rohtak, India.

Correspondence to Mala Kamboj, MDS. Senior Professor & Head, Department of Oral and Maxillofacial Pathology and Microbiology, Post Graduate Institute of Dental Sciences, Pt B.D. Sharma University of Health Sciences, Rohtak 124001, India. malskam@gmail.com
• Received: June 6, 2021   • Revised: June 30, 2021   • Accepted: August 10, 2021

Copyright © 2022. The Korean Academy of Conservative Dentistry

This is an Open Access article distributed under the terms of the Creative Commons Attribution Non-Commercial License (https://creativecommons.org/licenses/by-nc/4.0/) which permits unrestricted non-commercial use, distribution, and reproduction in any medium, provided the original work is properly cited.

  • 16 Views
  • 1 Download
  • 1 Web of Science
prev next
  • Objectives
    This pilot study aimed to establish the interrelationship between collagen and mast cells in periapical granulomas and periapical cysts.
  • Materials and Methods
    An observational cross-sectional study was conducted on the paraffin-embedded tissue sections of 68 specimens (34 periapical granulomas and 34 periapical cysts). The specimens were stained with picrosirius to observe collagen fiber birefringence and anti-tryptase antibody to evaluate the mast cell count immunohistochemically. The mean number and birefringence of collagen fibers, as well as the mean number of mast cells (total, granulated, and degranulated), and the mean inflammatory cell density were calculated. The data obtained were analyzed using the Kruskal Wallis test, Mann Whitney U test, and Spearman correlation test (p < 0.05).
  • Results
    The mean number of thick collagen fibers was higher in periapical cysts, while that of thin fibers was higher in granulomas (p = 0.00). Cysts emitted orange-yellow to red birefringence, whereas periapical granulomas had predominantly green fibers (p = 0.00). The mean inflammatory cell density was comparable in all groups (p = 0.129). The number of total, degranulated, and granulated mast cells exhibited significant results (p = 0.00) in both groups. Thick cyst fibers showed significant inverse correlations with inflammation and degranulated mast cells (p = 0.041, 0.04 respectively).
  • Conclusions
    Mast cells and inflammatory cells influenced the nature of collagen fiber formation and its birefringence. This finding may assist in the prediction of the nature, pathogenesis, and biological behavior of periapical lesions.
Periapical lesions are inflammatory lesions that form around roots of the teeth as a consequence of bacterial infection within the pulp canal [1]. The most common human periapical inflammatory lesions encountered in clinical practice are periapical abscesses, granulomas, and cysts. They can form in response to chronic irritation due to microbial and chemical stimuli, activated immune response, and bone resorption in periapical tissues [2,3]. Periapical cysts (PCs) evolve from epithelial remnant cells within periapical granulomas (PGs), with the formation of the cystic lumen caused by a chronic inflammatory reaction [4]. The accurate diagnosis of a periapical lesion as a cyst or granuloma helps dentists choose a precise treatment strategy [5].
Biopsy and histopathological evaluation are the gold standard to confirm the type of periapical lesions [6]. However, the accurate diagnosis and differentiation of periapical lesions become challenging when the cyst epithelium has degenerated and been replaced by an inflammatory granulomatous lesion. This may occur due to severe bacterial infections or the effects of irrigation during endodontic procedures [7].
Collagen fibers help to maintain structural integrity, determine tissue function, and provide tensile strength. Picrosirius red staining accentuates the natural birefringence of collagen fibers and imparts a red, orange, yellow, or green color when viewed under polarized light [8]. The collagen fiber orientation produced by mechanical stress persists for a long time in tissues and can be detected using a polarizing microscope [7]. This property helps to distinguish various skin lesions, odontogenic cysts, and tumors [9,10].
A vast number of inflammatory cells, chiefly lymphocytes, macrophages, plasma cells, eosinophils, mast cells, and several cytokines, are present in periapical lesions [11]. Mast cells have been detected in the inflammatory infiltrates of granulomas and cysts, suggesting that they may play a role in the inflammatory mechanism of these lesions [2].
Mast cells contain numerous granules that secrete several substances, including leukotrienes and prostaglandins, as well as various pro-inflammatory or mitogenic cytokines [2]. Mast cells influence tissue repair and exhibit properties of collagen synthesis by activating fibroblasts to produce collagen, thereby contributing to wound healing and fibrosis [12]. On the contrary, mast cells also secrete proteolytic enzymes such as tryptase and chymase, which possess collagenolytic properties that lead to the destruction of fibrillar collagen in connective tissue, destroying the extracellular matrix and promoting tissue remodeling [13,14].
To date, no study has evaluated the correlation of collagen fibers, mast cells, and their combined role in the behavior of periapical lesions.
Keeping in mind the dual nature of the effect of mast cells on collagen, the present study was conceived with an intent to evaluate collagen fiber bundles and localize mast cell expression in PGs and PCs by polarizing microscopy and immunohistochemistry using picrosirius red staining and mast cell tryptase, respectively.
Study design and tissue samples
Sixty-eight specimens (34 PGs and 34 PCs) were obtained by retrieving formalin-fixed paraffin-embedded tissue blocks, as well as new biopsy specimens submitted to the Department of Oral and Maxillofacial Pathology and Oral Microbiology, Post Graduate Institute of Dental Sciences, Rohtak, India. The study was approved by the Institutional Ethics Committee (protocol no: PGIDS/IEC/2018/19 dated November 30, 2018).
All PGs and PCs were obtained from human permanent, mature teeth from all dental groups (anterior and posterior) prior to endodontic treatment and their diagnoses were confirmed based on well-defined clinical, radiographic, and histopathological criteria. All selected specimens were cases of periapical radiolucent lesions, associated with non-vital pulp in cases of cysts. PGs showed granulomatous tissue with infiltration of inflammatory cells and without evidence of epithelial lining. PCs were diagnosed as presenting fully developed cavities lined by stratified squamous epithelium with variable thickness and a fibrous wall [2] (Figure 1A-1D).
Figure 1

(A, B) A selected periapical granuloma; a periapical radiograph shows a well-defined radiolucency located over the root apex of the right maxillary central incisor (red arrow), and histological sections reveal fibro-cellular connective tissue stroma infiltrated by inflammatory cells and abundant foamy macrophages (H&E ×40). (C, D) A selected periapical cyst; a periapical radiograph shows a well-defined radiolucency, located over the root apex of the right maxillary lateral incisor (red arrow), and histological sections reveal stratified squamous, nonkeratinized epithelial lining with an arcading pattern and underlying fibro-collagenous connective tissue capsule with inflammatory cell infiltrate (H&E ×40).
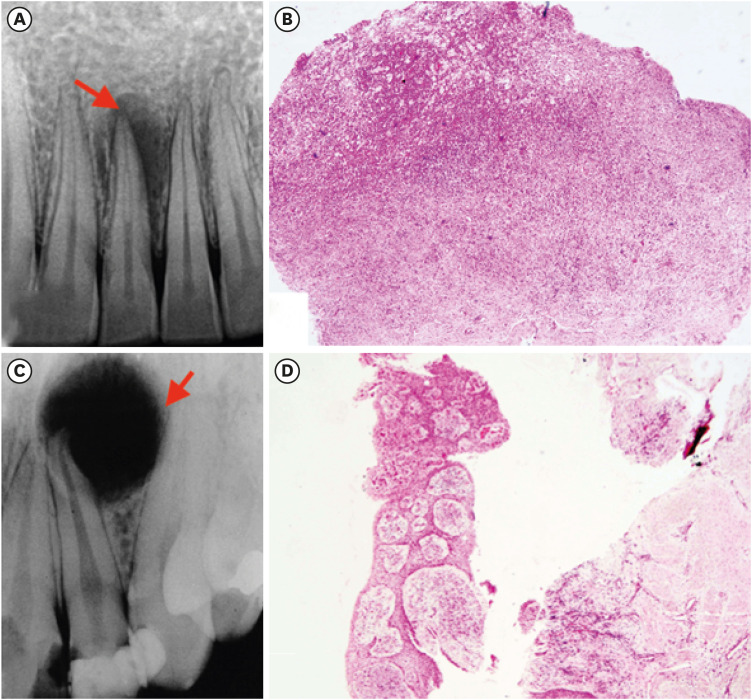
H&E, hematoxylin and eosin.
rde-47-e12-g001.jpg
Cases not histologically proven as periapical lesions, as well as patients unwilling to undergo biopsy or who refused to give consent for participating in the study, were excluded. Patients with a history or symptoms of chronic systemic conditions, such as diabetes and hypertension, or endodontically treated teeth were also excluded.
Biopsies were performed in patients willing to participate in the study. The procedure was carried out under local anesthesia. Granulomatous tissue associated with the defective bone was curetted. Osteotomy of 3–4 mm was performed if intact bone was present around the lesion in order to enter into the lesion, followed by removal of the granulation tissue until the root apex was visible. Resection of 3 mm of the root tip was performed perpendicular to the long axis of the root, and further root apex preparation was executed with ultrasonic tips followed by retrofilling [15].
Morphological analysis

1. Hematoxylin and eosin staining

For morphological analysis, 5-µm-thick tissue sections were stained with hematoxylin and eosin for a histopathological diagnosis and evaluation of inflammatory cells. The procedure used Harris hematoxylin and eosin Y staining solutions. The formalin-fixed tissue sections were deparaffinized, followed by rehydration in decreasing grades of alcohol. The tissue sections were stained with hematoxylin for 10 minutes, the slides were then washed with tap water for 2 minutes, and the process of bluing (color change from red to blue) took place. The slides were stained with a filtered eosin stain (4 minutes) and rinsed in tap water. The slides were then cleared in xylene, dehydrated in ascending grades of alcohol, and mounted [16]. Under a bright-field microscope, the intensity of the inflammatory infiltrate was evaluated on a 4-grade scale [17]. Inflammatory cells were counted in 10 random fields at ×100 magnification and divided into 4 grades: grade 0, no inflammation; grade 1, < 15 cells/field; grade 2, 15–50 cells/field; and grade 3, > 50 cells/field. After grading, 2 groups were formed based on the inflammatory score. Group A included grades 0–2, and group B corresponded to grade 3.

2. Picrosirius red staining

Another section was stained with picrosirius red, prepared using the method recommended by Puchtler et al. [18] to determine the collagen fiber birefringence and thickness. In this process, 0.1 g of Sirius Red F3BA was dissolved in 100 mL of saturated picric acid (both from Sigma Aldrich, St. Louis, MO, USA). Next, 5-µm-thick tissue sections were deparaffinized, followed by rehydration in decreasing grades of alcohol and hydration with deionized water. Staining was then done with 0.1% picrosirius red stain for 1 hour at room temperature. Sections were rinsed thoroughly in distilled water, counterstained with Mayer’s hematoxylin (5–6 minutes), and cover-slipped. Tissue sections of fibroma served as a positive control.

3. Assessment of collagen fibers

The color of the collagen fibers was divided into 3 groups for analysis: green (ranging from blue to green), yellow (including yellowish-green and yellowish-orange), and red (including orange and red) [17]. The overall birefringence of the fibers, along with the color patterns of thick and thin fibers, was noted. The percentage of different color fibers in each group was calculated. A total of 150 fibers (50 each in 3 high-power fields at ×40) were measured; based on their width, they were classified as thick (1.2–2.4 μm) or thin (< 0.8 μm), and the mean number of thick and thin collagen fibers was calculated.
Immunohistochemical methods
For the immunohistochemical staining, 4-µm-thick tissue sections were deparaffinized, followed by rehydration in descending grades of alcohol and hydration with deionized water. Antigen retrieval was then done with Tris-EDTA (pH 9) in a pressure cooker. Sections were then incubated with anti-tryptase antibody (monoclonal mouse anti-human mast cell tryptase, clone AA1; Diagnostic Biosystems, Pleasanton, CA, USA) diluted to 1:450 for 50 minutes at room temperature in a humidifying chamber. After 2 washes with phosphate-buffered saline solution, sections were incubated with streptavidin-biotin-peroxidase complex (Biogenex; Telangana, India) for 30 minutes to bind the primary antibodies. Peroxidase activity was visualized by immersing sections in diaminobenzidine (HK124-5K; Biogenex, Telangana, India) chromogen for 10 minutes at room temperature, resulting in a brown reaction product. The sections were counterstained with Mayer’s hematoxylin and cover-slipped. Sections of tonsils and lymph nodes served as positive controls. The negative control comprised sections in which the primary antibody was omitted and replaced by phosphate-buffered saline.

1. Immunostaining assessment

The slides were evaluated under a bright-field research microscope using computerized image software to conduct a morphometric analysis of mast cells. All tissue sections were observed under the light microscope at ×100 magnification to determine the areas presenting with the highest number of tryptase positive mast cells and then their quantification was done at ×400 magnification. Tryptase-positive mast cells were noted in 6 different areas, out of which 3 microscopic fields corresponded to the central portion of the connective tissue and 3 in peripheral portion based on the criteria adapted from Costa Neto et al. [13]. The immunoreactive mast cells were graded according to their granulated or degranulated state, and mean count of tryptase-positive mast cells was calculated.
Three independent observers evaluated the birefringence pattern, thickness of collagen fibers, and mast cell number, along with their granulated or degranulated status. To avoid inter-observer bias, the mean count of the thick and thin collagen fibers and mast cells of all 3 observers was taken as the final value.
Statistical analysis
The results were presented and analyzed using SPSS version 21.0 (IBM Corp., Armonk, NY, USA). The data obtained from the study were checked for normality by applying the Shapiro-Wilk test. Since the data showed non-normality, the Mann-Whitney U test was applied for between-group comparisons. The Spearman rho correlation test was performed to analyze the relationship of collagen fibers with mast cells and inflammatory cells. A p < 0.05 was considered to indicate statistical significance.
Morphological analysis

1. Mean inflammatory cell density

The analysis of the intensity of inflammatory infiltrate revealed 13 PCs with mild to moderate inflammation and 21 with severe inflammation. Seven and 27 PGs presented with mild to moderate and severe inflammation, respectively (Table 1).
Table 1

Mean and standard deviation of types of collagen fibers and inflammatory cell density in periapical cysts and granulomas

Parameters Periapical cysts (n = 34) Periapical granulomas (n = 34) p value*
Types of collagen
Thick fibers 66.88 ± 10.89 38.94 ± 19.68 0.000
Thin fibers 57.03 ± 11.37 80.26 ± 20.19 0.000
Inflammatory cell density 2.23 ± 0.60 2.40 ± 0.48 0.129
Data are presented as mean ± standard deviation.
*Mann-Whitney U test; Statistically significant.

2. Collagen fiber characteristics

Using the non-parametric Mann-Whitney U test, a higher mean number of thick collagen fibers was found in PCs, while thin collagen fibers predominated in PGs. A statistically significant difference was found for both thick and thin fibers (p = 0.00). The detailed analysis of collagen fibers is tabulated in Table 1.
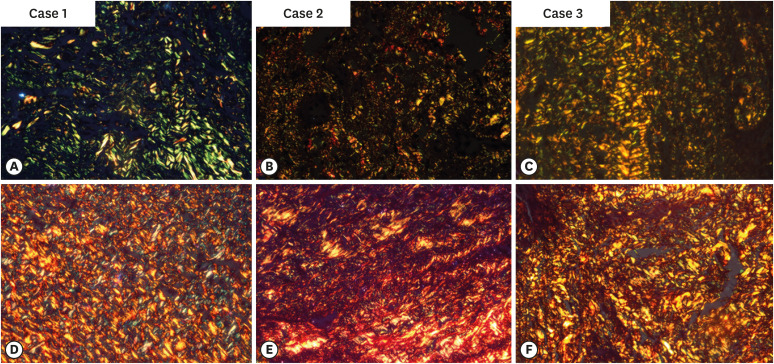
Red birefringence predominated in both thick and thin collagen fibers in PCs. In contrast, in PGs, the thick collagen fibers were mostly yellow, while the thin collagen fibers were green. The mean number of thick and thin fibers with their polarization colors was also evaluated. The thick fibers in PGs appeared yellow (22.00 ± 11.01), while those in PCs were red (54.97 ± 14.01). The thin fibers in PGs emitted green birefringence (45.85 ± 21.94), while those in PCs emitted red r (36.68 ± 14.22) (Figure 2A-2F). A comparison of the mean number of collagen fibers according to polarization color in each group is presented in Table 2.
Figure 2

Photomicrographs of 3 cases showing predominant green birefringence of collagen fibers in periapical granulomas (A-C); case 1A shows predominantly green birefringence, case 2B depicts immature and thin fibers, and case 3C depicts greenish-yellow birefringence and immature fibers of a periapical granuloma. Predominantly red birefringence of collagen fibers in periapical cysts (D-F). Case 1D shows the ‘basket weave’ pattern associated with a periapical cyst, case 2E shows predominant orangish-red birefringence, and case 3F depicts the mature pattern formation associated with a periapical cyst. The sections were stained with picrosirius-red stain and analyzed under polarized light (×400).
rde-47-e12-g002.jpg
Table 2

Mean, standard deviation, and comparison of thick and thin collagen fibers with polarization colors in periapical cysts and granulomas

Study groups Polarization colors
Green Yellow Red
Thick Thin Thick Thin Thick Thin
Periapical cysts 3.21 ± 3.95 6.56 ± 3.74 7.03 ± 6.98 13.41 ± 6.11 54.97 ± 14.01 36.68 ± 14.22
Periapical granulomas 9.97 ± 3.57 45.85 ± 21.94 22.00 ± 11.01 28.35 ± 16.55 10.41 ± 13.72 5.44 ± 8.33
p value* 0.000 0.000 0.000 0.000 0.000 0.000
Data are presented as mean ± standard deviation.
*Mann-Whitney U test; Statistically significant.
Immunohistochemical analysis

1. Mean number of total mast cells

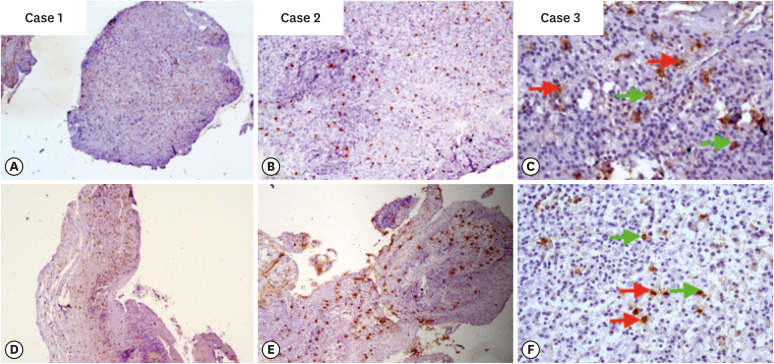
The immunohistochemical expression of tryptase in mast cells exhibited a cytoplasmic pattern, and immunoreactivity was observed in all cases of PCs and PGs (Figure 3A-3F). The mean number of mast cells in the center and periphery of connective tissue was higher in PGs. A statistically significant difference in the total number of mast cells was observed between PCs and PGs (p = 0.00) respectively. The intergroup differences were significant in both the central (p = 0.00) and peripheral (p = 0.01) areas (Table 3).
Figure 3

Photomicrographs of 3 cases of periapical granulomas (A-C); case 1A shows immunoexpression of tryptase positive mast cells (×40), case 2B depicts hot spots for the evaluation of mast cells (×100), and case 3C shows granulated (green arrow) and degranulated (red arrow) mast cells in fibro-cellular connective tissue stroma (×400). Photomicrographs (D-F) depicting 3 cases of periapical cysts; case 1D reveals immunoexpression of tryptase-positive mast cells (×40), case 2E shows hot spots for the evaluation of mast cells (×100), and case 3F depicts granulated (green arrow) and degranulated (red arrow) mast cells in fibro-cellular connective tissue stroma (×400).
rde-47-e12-g003.jpg
Table 3

Comparison of mean mast cell density in the central and peripheral parts of connective tissue in periapical cysts and granulomas

Groups Mast cell density
Peripheral Central Total
Periapical cysts 23.88 ± 8.07 23.79 ± 7.71 47.67 ± 14.21
Periapical granulomas 29.74 ± 9.57 29.58 ± 9.52 59.32 ± 17.39
p value* 0.010 0.000 0.000
Data are presented as mean ± standard deviation.
*Mann-Whitney U test; Statistically significant.

2. Degranulated versus granulated mast cells

The density of degranulated mast cells was higher in PCs than in PGs in the peripheral connective tissue stroma. In contrast, the number of granulated mast cells was higher in PGs in both the central and peripheral connective tissue (Table 4).
Table 4

Comparison of mean degranulated and granulated mast cells in the central and peripheral parts of connective tissue

Groups Central Peripheral
Degranulated mast cells Granulated mast cells Degranulated mast cells Granulated mast cells
Periapical cysts 8.32 ± 3.95 15.52 ± 5.94 15.05 ± 4.33 8.82 ± 6.11
Periapical granulomas 8.76 ± 4.72 21.82 ± 7.46 9.17 ± 4.02 20.55 ± 7.97
p value* 0.012 0.000 0.005 0.000
Data are presented as mean ± standard deviation.
*Mann-Whitney U test; Statistically significant.
Upon application of the Spearman correlation test for the associations of collagen fibers with mast cells and inflammatory cells, mast cells were significantly and inversely associated with total collagen fibers in PCs (r = −0.424, p = 0.013). Significant inverse correlations were also observed between thick fibers and inflammation as well as mast cells in PCs (r = −0.352, p = 0.041; r = −0.182, p = 0.032, respectively). Furthermore, degranulated mast cells in the central part of the connective tissue of PCs were inversely correlated with thick fibers in PCs (r = −0.35, p = 0.04). Thin fibers in PCs were not significantly correlated with any of the factors. No significant correlations were found in PGs.
The findings of the current study regarding thick fiber birefringence of PCs, but not thin fibers, concurred with those reported by Hirshberg et al. [19]. The present study findings are in contrast with the results of Shetty et al. [20], who reported that the green-yellow color predominated in both thick and thin fibers of PCs. The slight predominance of the green-yellow color in radicular cysts in previous studies might be attributed to inflammation, which could affect the packing of collagen fibers.
The mean numbers of thick and thin fibers according to their polarization colors were also evaluated. Similar results have been reported in previous studies with respect to PCs [21,22]. The findings of the present study, however, were discordant with those of other studies [8,23,24]. This discrepancy could be attributed to differences in study designs.
In the present study, high inflammation (an inflammatory score of 3) was observed in 27 of 34 cases PGs and 21 of 34 PCs. A significant inverse association was observed between the number of thick fibers in PCs and inflammatory cell density (p = 0.04). It was also observed that inflammation deteriorated the original structure of collagen fibers, leading to their structural disorganization. Concordant results were observed by Vij et al. [10]. It was stated that inflammation could change the microenvironment of the extracellular matrix, which directly influences collagen synthesis and assembly. It was also postulated by previous authors that the proteoglycan content of collagen fibers changes at the time of maturation, leading to dehydration and an increase in the diameter of collagen fibers, and thereby causing an enhanced intensity of birefringence and change in the polarization color [10,17,25]. Inflammatory cells play a dual role in periapical lesions by releasing various cytokines, lymphokines, and growth factors, which sometimes lead to the formation of thick, mature, orange to red, closely packed collagen bundles with an absence of intense collagenolytic activity. In contrast, increased collagenolytic activity could cause local destruction of collagen fibers, which then appear green to yellow under a polarized microscope.
When a mast cell becomes degranulated/activated, the secretory granules release tryptases along with other extracellular matrix mediators [13]. Mast cells are said to play a pivotal role in the pathogenesis and progression of periapical lesions, especially in PCs, leading to their expansion, resorption of bone, vasodilatation and angiogenesis, an inflammatory cell response, and increased content of cystic fluid [26].
The comparison of mast cell density revealed significantly higher counts in PGs than in PCs. This finding is consistent with previous studies conducted on PCs and PGs [3,13,14]. However, this does not agree with other studies that reported higher number of mast cells in PCs than in PGs [27,28,29,30]. The difference may be due to previous studies’ use of toluidine blue histochemical staining, which is non-specific for mast cells and tends to yield false results.
In this study, the mean number of mast cells was correlated with the mean number of collagen fibers, and a significant inverse correlation was found in PCs (p = 0.013), whereas the association was non-significant in PGs. These findings indicate that the number of immature fibers and mast cells are directly associated. Activated mast cells release tryptase, which in turn activates fibroblasts, leading to the production of new loosely packed and immature collagen fibers. This study found that in the presence of inflammatory cells and an increased number of mast cells, the number of thin, immature, and loosely packed collagen fibers was greater, while thick, mature, and densely packed collagen fibers were infrequent.
A higher recurrence rate was observed with an increased size of the periapical lesions by Toskos et al. [31]. Thus, mast cells, which plays a role in the expansion of periapical lesions, may aid in the prediction of recurrence and prognosis. Moreover, a reciprocal correlation of inflammatory cells and healing, as well as recurrence, was reported by Thakur et al. [32]. Hence, the overall grade of inflammation could serve as a preliminary indicator for the detection of recurrence and healing of periapical lesions.
The present study observed a significant role of the mean number of collagen fibers, their birefringence, and mast cell density in predicting the nature, pathogenesis, and biological behavior of periapical lesions. Future studies could validate these findings and further explore the characteristics of collagen fibers in periapical lesions using picrosirius red staining.

Conflict of Interest: No potential conflict of interest relevant to this article was reported.

Author Contributions:

  • Conceptualization: Kamboj M.

  • Data curation: Bansal D.

  • Formal analysis: Kamboj M, Bansal D.

  • Funding acquisition: Bansal D.

  • Investigation: Kamboj M, Bansal D.

  • Methodology: Kamboj M, Bansal D.

  • Project administration: Kamboj M, Marwah N, Narwal A.

  • Resources: Devi A, Bansal D.

  • Software: Bansal D.

  • Supervision: Kamboj M, Marwah N, Narwal A.

  • Validation: Devi A, Bansal D.

  • Visualization: Devi A, Bansal D.

  • Writing - original draft: Kamboj M, Bansal D.

  • Writing - review & editing: Marwah N, Narwal A, Devi A.

  • 1. Vernal R, Dezerega A, Dutzan N, Chaparro A, León R, Chandía S, Silva A, Gamonal J. RANKL in human periapical granuloma: possible involvement in periapical bone destruction. Oral Dis 2006;12:283-289. ArticlePubMed
  • 2. Ledesma-Montes C, Garcés-Ortíz M, Rosales-García G, Hernández-Guerrero JC. Importance of mast cells in human periapical inflammatory lesions. J Endod 2004;30:855-859. ArticlePubMed
  • 3. Marçal JR, Samuel RO, Fernandes D, de Araujo MS, Napimoga MH, Pereira SA, Clemente-Napimoga JT, Alves PM, Mattar R, Rodrigues V Jr, Rodrigues DB. T-helper cell type 17/regulatory T-cell immunoregulatory balance in human radicular cysts and periapical granulomas. J Endod 2010;36:995-999. ArticlePubMed
  • 4. Syed Ismail PM, Apoorva K, Manasa N, Rama Krishna R, Bhowmick S, Jain S. Clinical, radiographic, and histological findings of chronic inflammatory periapical lesions: a clinical study. J Family Med Prim Care 2020;9:235-238. PubMedPMC
  • 5. Natanasabapathy V, Arul B, Mishra A, Varghese A, Padmanaban S, Elango S, Arockiam S. Ultrasound imaging for the differential diagnosis of periapical lesions of endodontic origin in comparison with histopathology: a systematic review and meta-analysis. Int Endod J 2021;54:693-711. ArticlePubMedPDF
  • 6. Juerchott A, Pfefferle T, Flechtenmacher C, Mente J, Bendszus M, Heiland S, Hilgenfeld T. Differentiation of periapical granulomas and cysts by using dental MRI: a pilot study. Int J Oral Sci 2018;10:17. ArticlePubMedPMCPDF
  • 7. Ji HJ, Park SH, Cho KM, Lee SK, Kim JW. Differential diagnosis of periapical cyst using collagen birefringence pattern of the cyst wall. Restor Dent Endod 2017;42:111-117. ArticlePubMedPMCPDF
  • 8. Jahagirdar PB, Kale AD, Hallikerimath S. Stromal characterization and comparison of odontogenic cysts and odontogenic tumors using picrosirius red stain and polarizing microscopy: A retrospective and histochemical study. Indian J Cancer 2015;52:408-412. PubMed
  • 9. El Safoury OS, Fawzy MM, El Maadawa ZM, Mohamed DH. Quantitation of mast cells and collagen fibers in skin tags. Indian J Dermatol 2009;54:319-322. ArticlePubMedPMC
  • 10. Vij R, Vij H, Rao NN. Evaluation of collagen in connective tissue walls of odontogenic cysts--a histochemical study. J Oral Pathol Med 2011;40:257-262. ArticlePubMed
  • 11. França GM, Carmo AF, Costa Neto H, Andrade AL, Lima KC, Galvão HC. Macrophages subpopulations in chronic periapical lesions according to clinical and morphological aspects. Braz Oral Res 2019;33:e047. PubMed
  • 12. Yong LC. The mast cell: origin, morphology, distribution, and function. Exp Toxicol Pathol 1997;49:409-424. PubMed
  • 13. Costa Neto H, de Andrade AL, Gordón-Núñez MA, Freitas RA, Galvão HC. Immunoexpression of tryptase-positive mast cells in periapical granulomas and radicular cysts. Int Endod J 2015;48:729-735. ArticlePubMed
  • 14. Andrade AL, Santos EM, Carmo AF, Freitas RA, Galvão HC. Analysis of tryptase-positive mast cells and immunoexpression of MMP-9 and MMP-13 in periapical lesions. Int Endod J 2017;50:446-454. PubMed
  • 15. Floratos S, Kim S. Modern Endodontic Microsurgery Concepts: A Clinical Update. Dent Clin North Am 2017;61:81-91. PubMed
  • 16. Ankle MR, Joshi PS. A study to evaluate the efficacy of xylene-free hematoxylin and eosin staining procedure as compared to the conventional hematoxylin and eosin staining: an experimental study. J Oral Maxillofac Pathol 2011;15:161-167. PubMedPMC
  • 17. Hirshberg A, Lib M, Kozlovsky A, Kaplan I. The influence of inflammation on the polarization colors of collagen fibers in the wall of odontogenic keratocyst. Oral Oncol 2007;43:278-282. ArticlePubMed
  • 18. Puchtler H, Waldrop FS, Valentine LS. Polarization microscopic studies of connective tissue stained with picro-sirius red FBA. Beitr Pathol 1973;150:174-187. ArticlePubMed
  • 19. Hirshberg A, Sherman S, Buchner A, Dayan D. Collagen fibres in the wall of odontogenic keratocysts: a study with picrosirius red and polarizing microscopy. J Oral Pathol Med 1999;28:410-412. ArticlePubMed
  • 20. Shetty A, Tamgadge A, Bhalerao S, et al. Study of polarization colors in the connective tissue wall of odontogenic cysts using picrosirius red stain. J Orofac Sci 2015;7:119-124.
  • 21. Singh HP, Shetty DC, Wadhwan V, Aggarwal P. A quantitative and qualitative comparative analysis of collagen fibers to determine the role of connective tissue stroma on biological behavior of odontogenic cysts: a histochemical study. Natl J Maxillofac Surg 2012;3:15-20. ArticlePubMedPMC
  • 22. Mahajan AM, Mahajan MC, Ganvir SM, Hazarey VK. The role of stroma in the expansion of odontogenic cysts and adenomatoid odontogenic tumor: a polarized microscopy study. J Nat Sci Biol Med 2013;4:316-320. ArticlePubMedPMC
  • 23. Aggarwal P, Saxena S. Stromal differences in odontogenic cysts of a common histopathogenesis but with different biological behavior: a study with picrosirius red and polarizing microscopy. Indian J Cancer 2011;48:211-215. ArticlePubMed
  • 24. Sreela KK, Cherian LM, Beena VT, Heera R. Comparison of picrosirius red staining of collagen fibers of Keratocystic odontogenic tumor with odontogenic cysts. IOSR J Dent Med Sci 2017;16:45-54.
  • 25. Szendröi M, Vajta G, Kovács L, Schaff Z, Lapis K. Polarization colours of collagen fibres: a sign of collagen production activity in fibrotic processes. Acta Morphol Hung 1984;32:47-55. PubMed
  • 26. Bergamini ML, Mardegan AP, DE Rosa CS, Palmieri M, Sarmento DJ, Hiraki KR, Costa AL, HassÉus B, Jonasson P, Braz-Silva PH. Presence of langerhans cells, regulatory T cells (Treg) and mast cells in asymptomatic apical periodontitis. Braz Oral Res 2020;34:e108. ArticlePubMed
  • 27. de Oliveira Rodini C, Batista AC, Lara VS. Comparative immunohistochemical study of the presence of mast cells in apical granulomas and periapical cysts: possible role of mast cells in the course of human periapical lesions. Oral Surg Oral Med Oral Pathol Oral Radiol Endod 2004;97:59-63. ArticlePubMed
  • 28. Drazić R, Sopta J, Minić AJ. Mast cells in periapical lesions: potential role in their pathogenesis. J Oral Pathol Med 2010;39:257-262. PubMed
  • 29. Fonseca-Silva T, Santos CC, Alves LR, Dias LC, Brito M Jr, De Paula AM, Guimarães AL. Detection and quantification of mast cell, vascular endothelial growth factor, and microvessel density in human inflammatory periapical cysts and granulomas. Int Endod J 2012;45:859-864. ArticlePubMed
  • 30. Mahita VN, Manjunatha BS, Shah R, Astekar M, Purohit S, Kovvuru S. Quantification and localization of mast cells in periapical lesions. Ann Med Health Sci Res 2015;5:115-118. ArticlePubMedPMC
  • 31. Toskos D, Di Bernardo JF. Periapical lesions: does the size of an endodontic lesion play a role in success and failure? Perio implant advisory 2019 [Internet]. Tulsa, OK: Dental Economics; 2020. updated 2020 Jan 2]. Available from: https://www.dentaleconomics.com/science-tech/endodontics/article/14074456/periapical-lesions-does-the-size-of-an-endodontic-lesion-play-a-role-in-success-and-failure.
  • 32. Thakur SK, Thakur R, Sankhyan A, Patyal A. A conservative approach to treat large periapical lesions: a report of two cases. Indian J Dent Sci 2019;11:225-228.

Tables & Figures

REFERENCES

    Citations

    Citations to this article as recorded by  

      • ePub LinkePub Link
      • Cite
        CITE
        export Copy Download
        Close
        Download Citation
        Download a citation file in RIS format that can be imported by all major citation management software, including EndNote, ProCite, RefWorks, and Reference Manager.

        Format:
        • RIS — For EndNote, ProCite, RefWorks, and most other reference management software
        • BibTeX — For JabRef, BibDesk, and other BibTeX-specific software
        Include:
        • Citation for the content below
        Interplay of collagen and mast cells in periapical granulomas and periapical cysts: a comparative polarizing microscopic and immunohistochemical study
        Restor Dent Endod. 2022;47(1):e12  Published online February 14, 2022
        Close
      • XML DownloadXML Download
      Figure
      • 0
      • 1
      • 2
      Interplay of collagen and mast cells in periapical granulomas and periapical cysts: a comparative polarizing microscopic and immunohistochemical study
      Image Image Image
      Figure 1 (A, B) A selected periapical granuloma; a periapical radiograph shows a well-defined radiolucency located over the root apex of the right maxillary central incisor (red arrow), and histological sections reveal fibro-cellular connective tissue stroma infiltrated by inflammatory cells and abundant foamy macrophages (H&E ×40). (C, D) A selected periapical cyst; a periapical radiograph shows a well-defined radiolucency, located over the root apex of the right maxillary lateral incisor (red arrow), and histological sections reveal stratified squamous, nonkeratinized epithelial lining with an arcading pattern and underlying fibro-collagenous connective tissue capsule with inflammatory cell infiltrate (H&E ×40).H&E, hematoxylin and eosin.
      Figure 2 Photomicrographs of 3 cases showing predominant green birefringence of collagen fibers in periapical granulomas (A-C); case 1A shows predominantly green birefringence, case 2B depicts immature and thin fibers, and case 3C depicts greenish-yellow birefringence and immature fibers of a periapical granuloma. Predominantly red birefringence of collagen fibers in periapical cysts (D-F). Case 1D shows the ‘basket weave’ pattern associated with a periapical cyst, case 2E shows predominant orangish-red birefringence, and case 3F depicts the mature pattern formation associated with a periapical cyst. The sections were stained with picrosirius-red stain and analyzed under polarized light (×400).
      Figure 3 Photomicrographs of 3 cases of periapical granulomas (A-C); case 1A shows immunoexpression of tryptase positive mast cells (×40), case 2B depicts hot spots for the evaluation of mast cells (×100), and case 3C shows granulated (green arrow) and degranulated (red arrow) mast cells in fibro-cellular connective tissue stroma (×400). Photomicrographs (D-F) depicting 3 cases of periapical cysts; case 1D reveals immunoexpression of tryptase-positive mast cells (×40), case 2E shows hot spots for the evaluation of mast cells (×100), and case 3F depicts granulated (green arrow) and degranulated (red arrow) mast cells in fibro-cellular connective tissue stroma (×400).
      Interplay of collagen and mast cells in periapical granulomas and periapical cysts: a comparative polarizing microscopic and immunohistochemical study

      Mean and standard deviation of types of collagen fibers and inflammatory cell density in periapical cysts and granulomas

      ParametersPeriapical cysts (n = 34)Periapical granulomas (n = 34)p value*
      Types of collagen
      Thick fibers66.88 ± 10.8938.94 ± 19.680.000
      Thin fibers57.03 ± 11.3780.26 ± 20.190.000
      Inflammatory cell density2.23 ± 0.602.40 ± 0.480.129

      Data are presented as mean ± standard deviation.

      *Mann-Whitney U test; Statistically significant.

      Mean, standard deviation, and comparison of thick and thin collagen fibers with polarization colors in periapical cysts and granulomas

      Study groupsPolarization colors
      GreenYellowRed
      ThickThinThickThinThickThin
      Periapical cysts3.21 ± 3.956.56 ± 3.747.03 ± 6.9813.41 ± 6.1154.97 ± 14.0136.68 ± 14.22
      Periapical granulomas9.97 ± 3.5745.85 ± 21.9422.00 ± 11.0128.35 ± 16.5510.41 ± 13.725.44 ± 8.33
      p value* 0.000 0.000 0.000 0.000 0.000 0.000

      Data are presented as mean ± standard deviation.

      *Mann-Whitney U test; Statistically significant.

      Comparison of mean mast cell density in the central and peripheral parts of connective tissue in periapical cysts and granulomas

      GroupsMast cell density
      PeripheralCentralTotal
      Periapical cysts23.88 ± 8.0723.79 ± 7.7147.67 ± 14.21
      Periapical granulomas29.74 ± 9.5729.58 ± 9.5259.32 ± 17.39
      p value*0.0100.0000.000

      Data are presented as mean ± standard deviation.

      *Mann-Whitney U test; Statistically significant.

      Comparison of mean degranulated and granulated mast cells in the central and peripheral parts of connective tissue

      GroupsCentralPeripheral
      Degranulated mast cellsGranulated mast cellsDegranulated mast cellsGranulated mast cells
      Periapical cysts8.32 ± 3.9515.52 ± 5.9415.05 ± 4.338.82 ± 6.11
      Periapical granulomas8.76 ± 4.7221.82 ± 7.469.17 ± 4.0220.55 ± 7.97
      p value*0.0120.0000.0050.000

      Data are presented as mean ± standard deviation.

      *Mann-Whitney U test; Statistically significant.

      Table 1 Mean and standard deviation of types of collagen fibers and inflammatory cell density in periapical cysts and granulomas

      Data are presented as mean ± standard deviation.

      *Mann-Whitney U test; Statistically significant.

      Table 2 Mean, standard deviation, and comparison of thick and thin collagen fibers with polarization colors in periapical cysts and granulomas

      Data are presented as mean ± standard deviation.

      *Mann-Whitney U test; Statistically significant.

      Table 3 Comparison of mean mast cell density in the central and peripheral parts of connective tissue in periapical cysts and granulomas

      Data are presented as mean ± standard deviation.

      *Mann-Whitney U test; Statistically significant.

      Table 4 Comparison of mean degranulated and granulated mast cells in the central and peripheral parts of connective tissue

      Data are presented as mean ± standard deviation.

      *Mann-Whitney U test; Statistically significant.


      Restor Dent Endod : Restorative Dentistry & Endodontics
      Close layer
      TOP