Articles
- Page Path
- HOME > Restor Dent Endod > Volume 28(4); 2003 > Article
- Original Article Analysis of temperature rise on the surface of buchanan plugger using thermocouple
- Jin-Suk Cho, Yun-Chan Hwang, Sun-Ho Kim, In-Nam Hwang, Bo-Young Choi#, Young-Jin Jeong#, Woo-Nam Juhng#, Won-Mann Oh
-
2003;28(4):-340.
DOI: https://doi.org/10.5395/JKACD.2003.28.4.334
Published online: July 31, 2003
Department of Conservative Dentistry, College of Dentistry, DSRI, Chonnam National University, Korea.
#School of Mechanical Systems Engineering, Chonnam National University, Korea.
- Corresponding author (wmoh@chonnam.ac.kr)
Copyright © 2003 Korean Academy of Conservative Dentistry
- 658 Views
- 3 Download
Abstract
-
This study was performed to evaluate the actual temperature rise on the surface of Buchanan plugger using thermocouple. The heat carrier system 'System B Heatsource' (Model 1005, Analytic Technologies, Redmond, WA, USA) and the Buchanan pluggers of F, FM, M and ML sizes are used for this study. The temperature was set to 200℃ on digital display and the power level on it was set to 10. Five thermocouples were placed in direct contact with the surface of each size of Buchanan's pluggers at 1 mm increments from the tip to the 4 mm length of shank. The heat control spring was touched for 5 seconds, and the temperature rise on the surface of the pluggers were measured at 1 sec intervals for more than 5 seconds with an accuracy of 0.01 using Data Logger. The data were statistically analyzed by one-way ANOVA.The results were as follows.
The position at which the temperature peaked was approximately at 1~2 mm far from the tip of Buchanan plugger (p<0.01).
The peak temperature was 215.25±2.28℃ in F plugger, 185.94±2.19℃ in FM plugger, 169.51±9.12℃ in M plugger, and 160.79±1.27℃ in ML plugger and the peak temperature was highest in F plugger and followed by, in descending order, FM plugger, M plugger. ML plugger showed the lowest peak temperature (p<0.01).
The temperature on the pluggers was decreased with the increase of touching time.
This results suggest that the actual temperature on the surface of the pluggers does not correlate well with the temperature set on digital display. Heat concentrates around the tip. The larger plugger reveals lower temperature rise relatively.
- 1. Schilder H. Filling root canals in three dimensions. Dent Clin North Am. 1967;723-744.ArticlePubMed
- 2. Nguyen NT. Obturation of the Root Canal System. Pathways of the Pulp. 1994;6th ed. St. Louis: Mosby Co.; 219-271.
- 3. Jurcak JJ, Weller RN, Kulild JC, Donley DL. In vitro intracanal temperatures produced during warm lateral condensation of gutta-percha. J Endod. 1992;18: 1-3.ArticlePubMed
- 4. Lee FS, Van Cura JE, BeGole E. A comparison of root surface temperatures using different obturation heat source. J Endod. 1998;24: 617-620.PubMed
- 5. Hand RE, Hugel EF, Tsaknis PJ. Effect of a warm gutta-percha technique on the lateral periodontium. Oral Surg Oral Med Oral Pathol. 1976;42: 395-401.PubMed
- 6. Marlin J, Schilder H. Physical properties of gutta-percha when subjected to heat and vertical condensation. Oral Surg Oral Med Oral Pathol. 1973;36: 872-879.ArticlePubMed
- 7. Barkhordar RA, Goodis HE, Watanabe L, Koundjian J. Evaluation of temperature rise on the outer surface of teeth during root canal obturation technique. Quintessence Int. 1990;21: 585-588.PubMed
- 8. Eriksson A, Albrektsson T, Grane B, McQueen D. Thermal injury to bone: a vital-microscopic description of heat effect. Int J Oral Surg. 1982;11: 115-121.PubMed
- 9. Eriksson RA, Albrektsson T. The effect of heat on bone regeneration. J Oral Maxillofac Surg. 1984;42: 705-711.PubMed
- 10. Eriksson AR, Albrektsson T. Temperature threshold levels for heat-induced bone tissue injury: a vital-microscopic study in the rabbit. J Prosthet Dent. 1983;50: 101-107.ArticlePubMed
- 11. Romero AD, Green DB, Wucherpfennig AL. Heat transfer to the periodontal ligament during root obturation procedures using an in vitro model. J Endod. 2000;26: 85-87.PubMed
- 12. Weller RN, Jurcak JJ, Donley DL, Kulild JC. A new model system for measuring intracanal temperatures. J Endod. 1991;17: 491-494.ArticlePubMed
- 13. Floren JW, Weller RN, Pashley DH, Kimbrough WF. Changes in root surface temperatures with in vitro use of the System B HeatSource. J Endod. 1999;25: 593-595.ArticlePubMed
- 14. Choi SA, Kim SH, Hwang YC, Youn C, Oh BJ, Choi BY, Juhng WN, Jeong SW, Hwang IN, Oh WM. Infrared thermographic analysis of temperature rise on the surface of buchanan plugger. J Korean Acad Conserv Dent. 2002;27: 382-388.Article
- 15. Buchanan LS. Continuous wave of condensation technique. Dent Today. 1996;15: 60-62. 64-67.
- 16. Analytic Technology Corp. Instruction guidelines for system B HeatSource model 1005. 1997;Glendora, California, USA.
REFERENCES
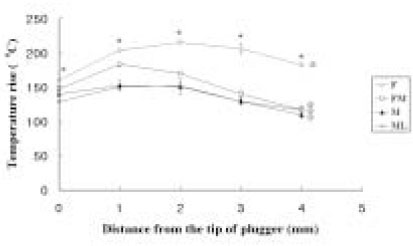
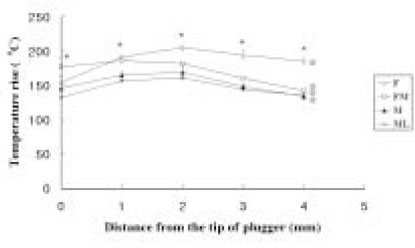
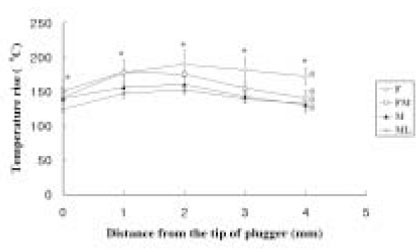
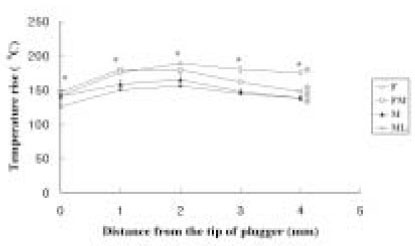
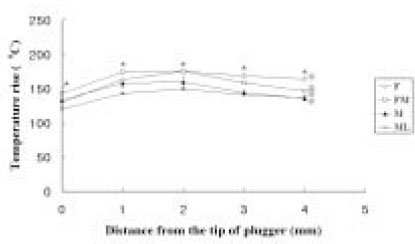
*: significant difference among time of measurement (p<0.01).
@: significant difference among distances (p<0.01).

*: significant difference among time of measurement (p<0.01).
@: significant difference among distances (p<0.01).

Tables & Figures
REFERENCES
Citations

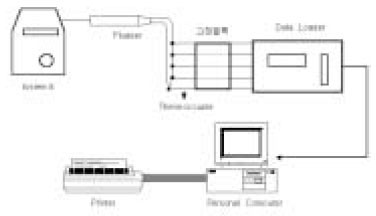
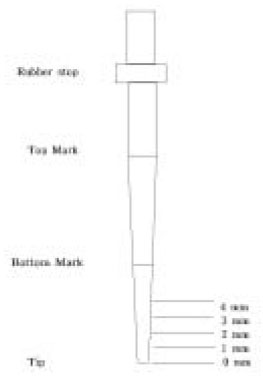
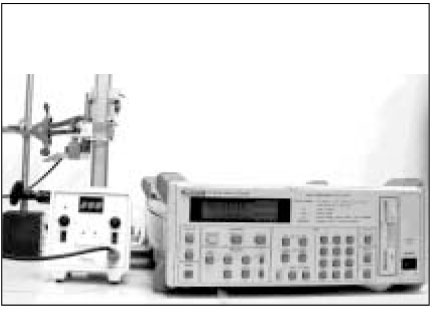


Fig. 1
Fig. 2
Fig. 3
Fig. 4
Fig. 5
Fig. 6
Fig. 7
Fig. 8
Temperature changes on the surface of Buchanan plugger (F) (Mean±S.D. (℃), n=10)
*: significant difference among time of measurement (p<0.01).
@: significant difference among distances (p<0.01).
Temperature changes on the surface of Buchanan plugger (FM) (Mean±S.D. (℃), n=10)
*: significant difference among time of measurement (p<0.01).
@: significant difference among distances (p<0.01).
Temperature changes on the surface of Buchanan plugger (M) (Mean±S.D. (℃), n=10)
*: significant difference among time of measurement (p<0.01).
@: significant difference among distances (p<0.01).
Temperature changes on the surface of Buchanan plugger (ML) (Mean±S.D. (℃), n=10)
*: significant difference among time of measurement (p<0.01).
@: significant difference among distances (p<0.01).
*: significant difference among time of measurement (p<0.01). @: significant difference among distances (p<0.01).
*: significant difference among time of measurement (p<0.01). @: significant difference among distances (p<0.01).
*: significant difference among time of measurement (p<0.01). @: significant difference among distances (p<0.01).
*: significant difference among time of measurement (p<0.01). @: significant difference among distances (p<0.01).

 KACD
KACD


 ePub Link
 Cite
Cite

