
Articles
- Page Path
- HOME > Restor Dent Endod > Volume 38(4); 2013 > Article
- Open Lecture on Statistics Statistical notes for clinical researchers: Understanding standard deviations and standard errors
- Hae-Young Kim
-
2013;38(4):-265.
DOI: https://doi.org/10.5395/rde.2013.38.4.263
Published online: November 12, 2013
Department of Dental Laboratory Science and Engineering, College of Health Science & Department of Public Health Science, Graduate School & BK21+ Program in Public Health Sciences, Korea University, Seoul, Korea.
- Correspondence to Hae-Young Kim, DDS, PhD. Associate Professor, Department of Dental Laboratory Science & Engineering, Korea University College of Health Science, San 1 Jeongneung 3-dong, Seongbuk-gu, Seoul, Korea 136-703. TEL, +82-2-940-2845; FAX, +82-2-909-3502, kimhaey@korea.ac.kr
©Copyights 2013. The Korean Academy of Conservative Dentistry.
This is an Open Access article distributed under the terms of the Creative Commons Attribution Non-Commercial License (http://creativecommons.org/licenses/by-nc/3.0/) which permits unrestricted non-commercial use, distribution, and reproduction in any medium, provided the original work is properly cited.
- 3,728 Views
- 49 Download
- 14 Crossref
The distinction between standard error and standard deviation is not easy to explain. Confusingly, standard error itself is a kind of standard deviation. However the fundamental difference between a standard deviation and a standard error is that the former is used in a descriptive purpose while the latter is used in an inference procedure, in which information regarding samples is used to make explanations about populations.
Standard deviation
A standard deviation, often abbreviated as SD, shows how much variation or dispersion from the average exists in the data. Distance from average or "deviation" is obtained by subtraction of the mean from each observed value, and the resultant deviation has positive or negative signs. As averaging the deviation values always gives zero, deviation values are squared to get all positive numbers. An averaged sum of squared deviation, usually called a variance, is turned to the original unit by applying square-root, which is the standard deviation. It is expressed as
 , in a sample of data; where n is the number of observations.
Therefore a standard deviation roughly represents an average distance from the average to the observations. In a normally-distributed data, 95% of observations are expected to be found in the range of X ± 2(or 1.96)*SD.
Bridge from sample to population: sampling distribution
Basically "Statistics" assumes the situation that we investigate a sample as a part of a corresponding bigger population. Statistical inference in which we get information on a population using information from the sample is the core contents of the discipline of "Statistics." The term "statistics" means any values calculated from samples, such as sample mean, median, mode, proportion, correlation coefficient.
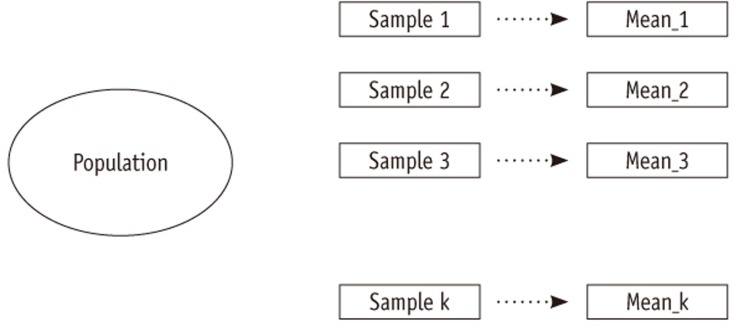
When we try to get information on a population using a sample, we could inevitably choose different sets of samples. Suppose we choose a sample size of 2, which means having two observations, from a population with five elements, e.g., 1,2,3,4, and 5. We can choose 25 sets of different samples (1,1), (1,2), (1,3)...(2,1),...(5,3), (5,4), (5,5) and get 9 different values of sample means with 1, 1.5, 2, 2.5, 3, 3.5, 4, 4.5, and 5. The concept is that we could choose many different sets of samples, which is called 'sample variability'. We always need to account for the sample variability caused by many different possible sets of samples because we investigate only a part of the population (sample) to make some statement about the target population.
Because of the sample variability, we could think distribution of different values of the statistic, e.g., different sample means. The distribution of all possible values of a sample statistic such as sample mean from the samples of the same size, is called a "sampling distribution." We could expect the mean of the sampling distribution is the same with the (true) population value if the distribution is approximately normal. The standard error is the standard deviation of a sampling distribution. Figure 1 depicts the selection of different samples which shows sample variability and result in a sampling distribution of sample mean. The sampling distribution is an important concept because it bridges a sample statistic observed in a sample to the true value in the corresponding population.
Standard error
A standard error is defined as "a standard deviation of the sampling distribution of a statistic" as mentioned above. Size of a standard error generally depends largely on the size of the sample. For an example, the standard error of the a sample mean is expressed as standard deviation/√sample size. A small standard deviation and a large sample size could lead to a small standard error of (sample) mean.
When a standard deviation is large we know the average distance from the mean and individual values is large so the distribution of values spreads widely. What about a big standard error? Similar to the case of the stand deviation, a big standard error means that the sampling distribution spreads widely and the average distance from the mean to a value in the sampling distribution is large. What is the relevance of finding observations at a large distance from the mean in a sampling distribution of sample means? Because the (true) population value is mean of the sampling distribution of sample means, the distance from the mean can be used to infer how much I could be incorrect in finding the (true) population value, on average. In other words the size of standard error could indicate how far the sample mean is located away from the (true) population value on average. Therefore smaller standard errors may mean that sample mean value I obtained may be located closer to the (true) population value on average and I have a smaller chance on making a larger amount of error. When investigating a sample, we would aim to find the (true) population value as close as possible; therefore having an estimate with a big difference (or error) from the population value would be disappointing. That's why the standard deviation of a sampling distribution is called a standard error.
The standard error has a crucial role in evaluating the statistics from a sample in determining the true population value. We use the standard error in calculating the confidence interval. For a large sample, the 95% confidence interval of a population mean is calculated as an interval from sample mean -1.96* SE to sample mean +1.96* SE, implicating that the interval will contain the (true) population mean with 95% certainty. If the sample mean obtained is located in the 95% of all possible sample means relatively close to the true value, and also not in the 5% of them located far from the true value in the sampling distribution, the calculated confidence interval should include the population value. If a standard error is small enough and resulting 95% confidence interval is narrow enough, the population value could be estimated precisely enough.
Also in a significance test of an estimate, the standard error of the estimate has a decisive role. When we make a decision whether a population mean value is a hypothesized mean value or not, we transform values into a standardized distribution such as z or t distribution. Such transformation is accomplished by difference between the observed mean and the hypothesized value, divided by the standard error of mean.
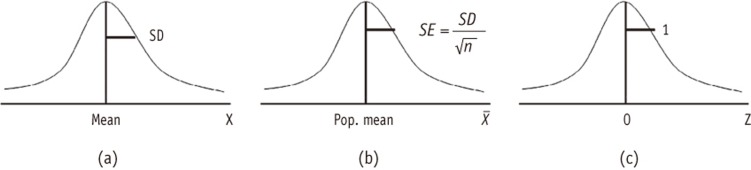
If the sample mean locates far away from the hypothesized value in a unit of the standard error, the absolute value of z or t will be large. When the calculated z or t value is larger than a designated critical value, e.g., 1.96, we conclude the observation showed significant difference from the hypothesis. Therefore what is important is not the size of the sample mean itself but the ratio of the sample mean over the standard error. If the standard error is large, e.g. 100,000 and the hypothesized value is zero, even with a large sample mean 10,000, the standardized value of z or t is only 0.1, which says the population value could be zero and the sample mean 10,000 is not significantly different from the hypothesized value zero. Therefore when you see any estimate, you must not think the size is small or big until you check the size of the standard error of the estimate. The same principle should be applied in evaluating all the sort of statistics calculated from the sample, such as mean difference, proportion, correlation coefficient, or regression coefficients. Figure 2 shows the three distinct distributions mentioned above.
Figure 2 shows the three distinct distributions mentioned above.
Tables & Figures
REFERENCES
Citations
Citations to this article as recorded by 
- Increased beta-band salience network connectivity predicts 12-month longitudinal changes in depressive and anxiety symptom severity in young adults: a resting-state EEG study
Claudio Imperatori, Mauro Adenzato, Simone Messerotti Benvenuti, Elena De Rossi, Giorgia Allegrini, Carola Dell’Acqua, Giuseppe Alessio Carbone, Rita B. Ardito, Benedetto Farina
European Archives of Psychiatry and Clinical Neuroscience.2026;[Epub] CrossRef - Severity of anhedonia is associated with hyper-synchronization of the salience-default mode network in non-clinical individuals: a resting state EEG connectivity study
Claudio Imperatori, Giorgia Allegrini, Aurelia Lo Presti, Giuseppe A. Carbone, Mauro Adenzato, Benedetto Farina, Rita B. Ardito
Journal of Neural Transmission.2025; 132(5): 731. CrossRef - Computerized Open-Source Navon Test (COSNaT): Normative data for the assessment of global processing abilities and simultanagnosia in the Italian population
Laura Veronelli, Roberta Daini, Marcello Gallucci, Carlo Toneatto, Silvia Pino, Lucia Ghielmi, Silvia Primativo
Behavior Research Methods.2025;[Epub] CrossRef - Revisiting the Technology–Organization–Environment Framework: Disruptive Technologies as Catalysts of Digital Transformation in the Turkish Banking Sector
Uğur Küçükoğlu, Ahmet Kamil Kabakuş
Sustainability.2025; 17(23): 10787. CrossRef - Global Processing Deficit in Amnestic Mild Cognitive Impairment
Laura Veronelli, Roberta Daini, Alice Mannino, Alessia Rossetti, Giulia Gilardone, Massimo Corbo, Silvia Primativo, Chiara Cerami
Journal of Alzheimer's Disease.2024; 101(4): 1151. CrossRef - Concerns about Mis-/Overuse of Antibiotics in Neonates Born at ≤32 Weeks Gestational Age in Latin American Neonatal Units: Eight Years of Experience in the EpicLatino Database
Horacio Osiovich, Ariel Salas, Angela B Hoyos, Carlos A Fajardo, Martha Baez, Luis Monterrosa, Carolina Villegas-Alvarez, Fernando Aguinaga, Maria I Martinini
Newborn.2024; 3(2): 83. CrossRef - A kommunikációba vetett bizalom kapcsolata az énhatékonysággal és az önértékeléssel fiatal felnőttek körében
Erzsébet Szél, Kitti Kóródi
Módszertani Közlemények.2023; 63(3): 40. CrossRef - The Semantic Association Test (SAT): normative data from healthy Italian participants and a validation study in aphasic patients
Elisabetta Banco, Laura Veronelli, Mariagrazia Briguglio, Claudio Luzzatti, Giuseppe Vallar
Neurological Sciences.2023; 44(5): 1575. CrossRef - How precise and how accurate can magnesium isotope analysis be by the sample-standard bracketing method?
Wen-Yu Wang, Jin-Ting Kang, Fang Huang
International Journal of Mass Spectrometry.2023; 491: 117102. CrossRef - Detecting faking responses during empirical research: a study in a developing country environment
Godson A. Tetteh, Kwasi Amoako-Gyampah, Amoako Kwarteng
International Journal of Lean Six Sigma.2021; 12(5): 889. CrossRef - Delineating the role of membrane blebs in a hybrid mode of cancer cell invasion in three-dimensional environments
Asja Guzman, Rachel C. Avard, Alexander J. Devanny, Oh Sang Kweon, Laura J. Kaufman
Journal of Cell Science.2020;[Epub] CrossRef - Class II treatment in early mixed dentition with the eruption guidance appliance: effects and long-term stability
Katri Keski-Nisula, Leo Keski-Nisula, Juha Varrela
European Journal of Orthodontics.2020; 42(2): 151. CrossRef - Nutrient intake and dietary quality changes within a personalized lifestyle intervention program for metabolic syndrome in primary care
Paula Brauer, Dawna Royall, Airu Li, Ariellia Rodrigues, Jennifer Green, Sharon Macklin, Alison Craig, Jennifer Pasanen, Lucie Brunelle, Scott Maitland, Rupinder Dhaliwal, Doug Klein, Angelo Tremblay, Caroline Rheaume, David M. Mutch, Khursheed Jeejeebhoy
Applied Physiology, Nutrition, and Metabolism.2019; 44(12): 1297. CrossRef - Validação da PANAS numa amostra portuguesa de pessoas idosas em resposta social
Laura Lemos, Helena Espirito-Santo, Cristiana Duarte-Figueiredo, Diana Santos, Luís Cunha, Fernanda Fernanda Daniel
Revista Portuguesa de Investigação Comportamental e Social.2019; 5(2): 49. CrossRef
 ePub Link
 Cite
CiteStatistical notes for clinical researchers: Understanding standard deviations and standard errors


Figure 1 Selection of different samples and sample variability.
Figure 2 Three distinct distributions. (a) distribution of a population or a sample; (b) a sampling distribution of sample means; (c) the standardized normal; (Z) distribution.
Figure 1
Figure 2
Statistical notes for clinical researchers: Understanding standard deviations and standard errors

