Articles
- Page Path
- HOME > Restor Dent Endod > Volume 29(6); 2004 > Article
- Original Article Rheological characterization of composites using a vertical oscillation rheometer
- In-Bog Lee, Byung-Hoon Cho, Ho-Hyun Son, Sang-Tag Lee, Chung-Moon Um
-
2004;29(6):-497.
DOI: https://doi.org/10.5395/JKACD.2004.29.6.489
Published online: November 30, 2004
Department of Conservative Dentistry, College of Dentistry, Seoul National University, Korea.
- Corresponding author: Chung-Moon Um. Department of Conservative Dentistry, College of Dentistry, Seoul National University, 28 Yoengun-dong, Chongro-gu, Seoul, Korea, 110-749. Tel: 82-2-2072-3953, 2651, Fax: 82-2-2072-3859, inboglee@snu.ac.kr
Copyright © 2004 Korean Academy of Conservative Dentistry
- 1,252 Views
- 1 Download
- 1 Crossref
Abstract
-
Objective The purpose of this study was to investigate the viscoelastic properties related to handling characteristics of composite resins.
-
Methods A custom designed vertical oscillation rheometer (VOR) was used for rheological measurements of composites. The VOR consists of three parts: (1) a measuring unit, (2) a deformation induction unit and (3) a force detecting unit. Two medium viscous composites, Z100 and Z250 and two packable composites, P60 and SureFil were tested. The viscoelastic material function, including complex modulus E* and phase angle δ, were measured. A dynamic oscillatory test was used to evaluate the storage modulus (E'), loss modulus (E") and loss tangent (tanδ) of the composites as a function of frequency (ω) from 0.1 to 20 Hz at 23℃.
-
Results The E' and E" increased with increasing frequency and showed differences in magnitude between brands. The E*s of composites at ω = 2 Hz, normalized to that of Z100, were 2.16 (Z250), 4.80 (P60) and 25.21 (SureFil). The magnitudes and patterns of the change of tanδ of composites with increasing frequency were significantly different between brands. The relationships between the complex modulus E*, the phase angle δ and the frequency ω were represented by frequency domain phasor form, E* (ω) = E*eiδ = E*∠δ.
-
Conclusions The viscoelasticity of composites that influences handling characteristics is significant different between brands. The VOR is a relatively simple device for dynamic, mechanical analysis of high viscous dental composites. The locus of frequency domain phasor plots in a complex plane is a valuable method of representing the viscoelastic properties of composites.
- 1. Craig RG, Powers JM. Restorative dental materials. 2002;11th ed. Mosby co; 91-98. 231-251.
- 2. Bayne SC, Thompson JY, Swift EJ, et al. A characterization of first-generation flowable composites. J Am Dent Assoc. 1998;129: 567-577.ArticlePubMed
- 3. Leinfelder KF, Prasad A. A new condensable composite for the restoration of posterior teeth. Dent Today. 1998;17(2):112-116.
- 4. Leinfelder KF, Radz GM, Nash RW. A report on a new condensable composite resin. Compendium. 1998;19(3):230-237.PubMed
- 5. Opdam NJM, Roeters JJM, Peters TCRB, et al. Consistency of resin composites for posterior use. Dent Mater. 1996;12: 350-354.ArticlePubMed
- 6. Ferracane JL, Moser JB, Greener EH. Rheology of composite restoratives. J Dent Res. 1981;60(9):1678-1685.PubMed
- 7. Tyas MJ, Jones DW, Rizkalla AS. The evaluation of resin composite consistency. Dent Mater. 1998;14: 424-428.ArticlePubMed
- 8. Al-sharaa KA, Watts DC. Stickiness prior to setting of some light cured resin composites. Dent Mater. 2003;19: 182-187.ArticlePubMed
- 9. Willems G, Lambrechts P, Braaem M, et al. A classification of dental composites according to their morphological and mechanical characteristics. Dent Mater. 1992;8: 310-319.ArticlePubMed
- 10. Duran RL, Powers JM, Craig RG. Viscoelastic and dynamic properties of soft liners and tissue conditioners. J Dent Res. 1979;58(8):1801-1807.ArticlePubMedPDF
- 11. Goldberg AJ. Viscoelastic properties of silicon, polysulfide, and polyether impression materials. J Dent Res. 1974;53(5):1033-1039.ArticlePubMedPDF
- 12. Watts DC. Elastic moduli and visco-elastic relaxation. J Dent. 1994;22: 154-158.ArticlePubMed
- 13. McCabe JF, Bowman AJ. The rheological properties of dental impression materials. Brit dent J. 1981;151: 179.ArticlePubMedPDF
- 14. Jacobsen PH, Whiting R, Richardson PCA. Viscosity of setting anterior restorative materials. Brit dent J. 1977;143: 393.ArticlePubMedPDF
- 15. Braden M. Viscosity and consistency of impression rubbers. J Dent Res. 1967;46(2):429-433.ArticlePubMedPDF
- 16. Barnes HA, Hutton JF, Walters K. An introduction to rheology. 1989;Elsevier Science Publishing co.
- 17. Moon TJ. Rheology. 1988;1st ed. Minumsa; 7-80. 190-195.
- 18. Kim SY. Polymer physics. 1994;2nd ed. Seoul University Press; 7-26.
- 19. Lee IB, Son HH, Um CM. Rheological Properties of flowable, conventional hybrid, and condensable composite resins. Dent Mater. 2003;19: 298-307.PubMed
- 20. Kim JW, Cho MS, Choi HJ, et al. Electrorheological fluid characterization via a vertical oscollation rheometer. Polym Test. 2001;20: 913-918.
- 21. Cho MS, Choi YJ, Choi SG, et al. Viscoelasticity of an electrorheological fluid using a vertical oscillation rheometer. J Mol Liq. 1998;75: 13-24.Article
- 22. Hyeon JC, et al. Theories and Applications of Rheology. 2001;1st ed. The Korean Society of Rheology; 237-239.
REFERENCES
Figure 2
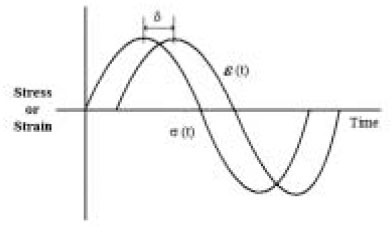
The relationship between strain ε(t), stress σ(t) and phase angle δ in dynamic oscillatory test

Figure 3
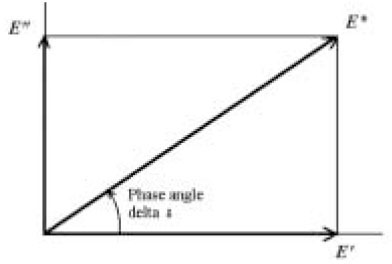
The relationship between storage (real) modulus E', loss modulus (imaginary) modulus E", complex modulus E* and phase angle δ in a complex plane

Figure 4
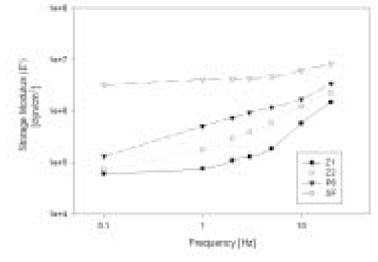
Storage modulus E' increased with increasing the frequency and showed differences in magnitude between brands

Figure 5
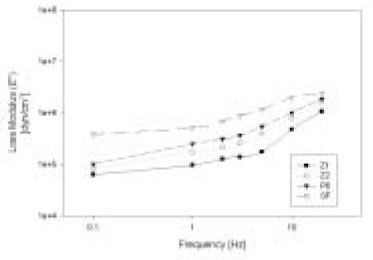
Loss modulus E" increased with increasing the frequency and showed differences in magnitude between brands

Figure 6
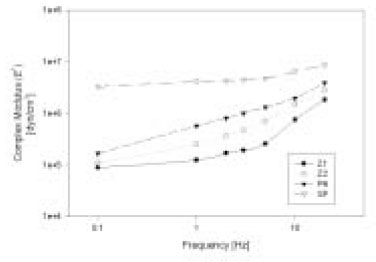
Complex modulus E* increased with increasing the frequency and showed differences in magnitude between brands

Figure 7
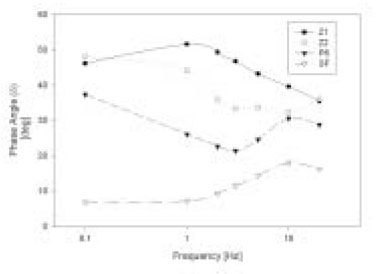
Phase angle δ of composite. The patterns of the change of δ of samples with increasing frequency showed the different characteristics of the composites between brands

Figure 10
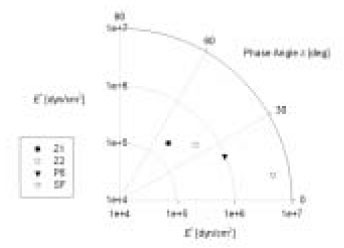
Phasor presentation of E* and δ, E*eiδ= E*∠δ, of composites at ω = 2 Hz in a polar coordinate system

Figure 11
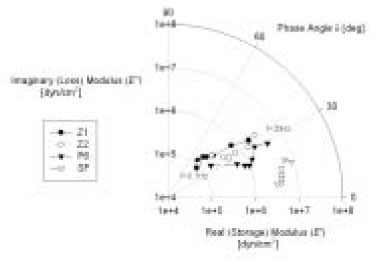
Locus of frequency domain phasor plots, G*(ω)eiδ = ∣ G*(ω) ∣ ∠δ of composites in a complex plane

Tables & Figures
REFERENCES
Citations
Citations to this article as recorded by 

- Effect of instrument compliance on the polymerization shrinkage stress measurements of dental resin composites
Deog-Gyu Seo, Sun-Hong Min, In-Bog Lee
Journal of Korean Academy of Conservative Dentistry.2009; 34(2): 145. CrossRef
Rheological characterization of composites using a vertical oscillation rheometer
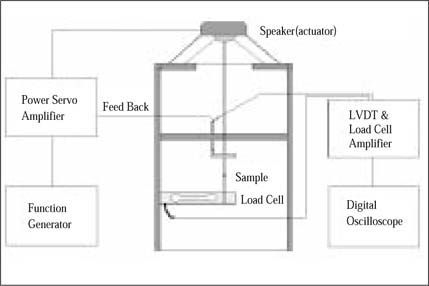
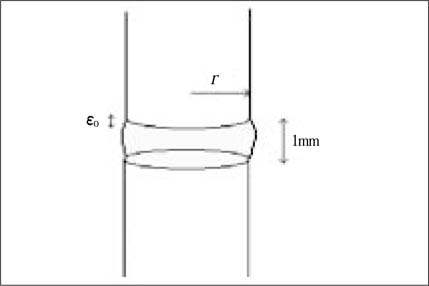


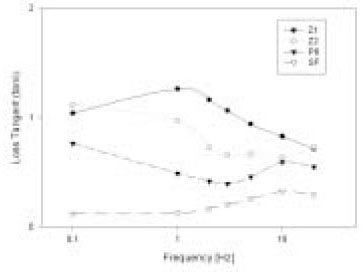
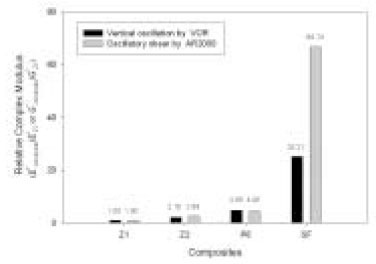


Figure 1-a
Diagram of the VOR (vertical oscillatory rheometer)
Figure 1-b
The geometry of measuring unit
Figure 2
The relationship between strain ε(t), stress σ(t) and phase angle δ in dynamic oscillatory test
Figure 3
The relationship between storage (real) modulus E', loss modulus (imaginary) modulus E", complex modulus E* and phase angle δ in a complex plane
Figure 4
Storage modulus E' increased with increasing the frequency and showed differences in magnitude between brands
Figure 5
Loss modulus E" increased with increasing the frequency and showed differences in magnitude between brands
Figure 6
Complex modulus E* increased with increasing the frequency and showed differences in magnitude between brands
Figure 7
Phase angle δ of composite. The patterns of the change of δ of samples with increasing frequency showed the different characteristics of the composites between brands
Figure 8
Loss tangent as a function of frequency
Figure 9
Relative complex modulus of composites normalized to that of Z1 at ω = 2 Hz
Figure 10
Phasor presentation of E* and δ, E*eiδ= E*∠δ, of composites at ω = 2 Hz in a polar coordinate system
Figure 11
Locus of frequency domain phasor plots, G*(ω)eiδ = ∣ G*(ω) ∣ ∠δ of composites in a complex plane
Figure 1-a
Figure 1-b
Figure 2
Figure 3
Figure 4
Figure 5
Figure 6
Figure 7
Figure 8
Figure 9
Figure 10
Figure 11
Rheological characterization of composites using a vertical oscillation rheometer
Phasor presentation of the complex modulus E* and phase angle (δ) of composite resins at various frequencies, E* (dyn/cm2) ∠δ(°)
Phasor presentation of the complex shear modulus G* and phase angle (δ) of composite resins at various frequencies, G* (dyn/cm2) ∠δ(°)
Table 1
Phasor presentation of the complex modulus E* and phase angle (δ) of composite resins at various frequencies, E* (dyn/cm2) ∠δ(°)
Table 2
Phasor presentation of the complex shear modulus G* and phase angle (δ) of composite resins at various frequencies, G* (dyn/cm2) ∠δ(°)

 KACD
KACD


 ePub Link
 Cite
Cite

