Magnitude of pulp space narrowing over time and contributing factors in teeth with vital pulp therapy: a retrospective cohort study
Article information

Abstract
Objectives
This study aimed to compare the magnitude of pulp space narrowing over time—measured as the change in pulp/tooth proportion from baseline—between mandibular molars treated with different types of vital pulp therapy (VPT) and their contralateral sound molars (controls). This study also investigated factors influencing the magnitude of pulp space narrowing in molars that have undergone VPT.
Methods
This retrospective cohort study involved the assessment of bitewing radiographs of VPT-treated molars and controls at baseline and follow-up. Using reference points and lines on the radiograph, pulp/tooth proportions were measured by examiners. The intraclass correlation coefficient (ICC) was used to report examiner reliability. The changes in pulp/tooth proportions from baselines were compared between subgroups using multilevel mixed effect linear regression and the Wald test.
Results
A total of 382 bitewing radiographs from 134 teeth were included. The follow-up period ranged from 6 to 84 months (mean, 27.12 ± 17.67 months). ICC values indicated good to excellent examiner reliability. Compared to the controls, changes in pulp/tooth proportion from baselines, indicating pulp space narrowing, were significantly greater in teeth with partial pulpotomy (at pulp chamber width) and coronal pulpotomy (at pulp canal width). Factors affecting the magnitude of pulp space narrowing included the more invasive type of VPT and the more severe preoperative diagnosis.
Conclusions
The magnitude of pulp space narrowing was greater in VPT-treated molars than in controls. The more invasive type of VPT and severe preoperative diagnosis were factors contributing to the magnitude of pulp space narrowing.
INTRODUCTION
Although vital pulp therapy (VPT) has a high success rate [1–7], one of its most common complications is pulp canal calcification (PCC) [1–4,7]. PCC refers to an increase in the production and deposition of hard tissue in response to several forms of irritation, resulting in a calcified narrowing of the pulp space [8]. Excessive calcification may impede the vitality/function of pulp tissue [9] and complicate endodontic treatment if indicated in the future [10,11]. Radiographically, studies reported a wide range of PCC, from 0% to 45%, in teeth that have undergone VPT [1–7]. However, only one study reported that 5.8% (1 out of 17 teeth) developed periapical radiolucency following total PCC or pulp obliteration in teeth treated with VPT [2]. It is worth noting that previous studies differ in VPT protocol and evaluation method of changes in pulp space. Moreover, pulp space evaluation is quite subjective, cross-sectional, and often a secondary study outcome [1–7].
Objective evaluations of calcified narrowing of the pulp space, based on changes in pulp/tooth ratio or proportion over time measured on radiographs, have been performed in previous studies on age estimation in forensic dentistry [12,13]. In general, factors influencing the narrowing of the pulp space include age, sex, drug use, and dental treatment received [14–16]. However, no study has specifically and objectively studied pulp space narrowing in VPT-treated teeth. Therefore, the objectives of this study were to (1) objectively compare the magnitude of pulp space narrowing over time, based on the change in pulp/tooth proportion values from baseline, between teeth that underwent different types of VPT and their contralateral sound molars (controls) and (2) study factors affecting the magnitude of pulp space narrowing in VPT-treated teeth.
METHODS
Study design and ethics approval
This retrospective cohort study was approved by the Human Experimentation Committee at the Faculty of Dentistry, Chiang Mai University, Chiang Mai, Thailand (registration number 39/2017). The study was conducted in accordance with the Declaration of Helsinki and reported following the Strengthening the Reporting of Observational Studies in Epidemiology (STROBE) guidelines [17].
Study participants
The study focused on the permanent mandibular molars of patients aged 6–18 years who underwent VPT, including a protective liner and base (LB), direct pulp capping (DPC), partial pulpotomy (PP), and coronal pulpotomy (CP), at the Pediatric Dentistry Clinic, Faculty of Dentistry, Chiang Mai University, Thailand from September 2012 to June 2022. The contralateral sound molars of the same patients served as controls.
For comprehensive treatment planning, preoperative bitewing radiographs on both sides were obtained for all patients; these served as the baseline for the control group. VPT was performed on the deep carious tooth within 1 to 2 weeks following the previously described VPT protocol in a published article from the same institution [18,19]. The immediate post-operative radiograph was taken and used as the baseline for the VPT group. Follow-up appointments were scheduled approximately every six months, during which bilateral bitewing radiographs were obtained, consistent with American Academy of Pediatric Dentistry recommendations for high-caries-risk patients [20]. The radiographs were positioned parallel to the crowns of the maxillary and mandibular teeth with the resultant images showing the contact areas as “opened” [21].
Sample size calculation
Sample size calculations were conducted using the program from http://powerandsamplesize.com [22], based on prior studies reporting incidences of pulp space narrowing following VPT: 35% in CP [4] and 5% in PP [1], thus at least 20 teeth was required for each treatment group. However, this study included all mandibular molars that met the inclusion criteria.
Inclusion and exclusion criteria
To be included in this study, the VPT-treated mandibular molars must have (1) a baseline and at least one follow-up bitewing radiograph of good quality; (2) no restorations or devices that interfere with the radiological evaluation of the pulp chamber; (3) all independent variables (predictors) from patient charts, including age (years, months), sex (male, female), follow-up period (recorded at one or more of the following intervals, as available: 6, 12, 18, 24, 30, 36, 48, 60, and 72 months); a preoperative pulpal diagnosis (normal pulp, reversible pulpitis, irreversible pulpitis) [23]; preoperative periapical lesion status (absence, presence); root formation status (mature, immature); type of VPT (LB, DPC, PP, CP); pulp-dressing material (ProRoot MTA, Dentsply Sirona, Tulsa, OK, USA; Biodentine, Septodont, Saint‑Maur‑des‑Fossés, France); type of irrigant (sodium hypochlorite, normal saline solution); site of exposure (mesial, distal); and VPT outcome (success, failure).
Regarding the VPT outcome, treatment was considered successful if the treated tooth demonstrated functional clinical and radiographic survival. Clinically, the tooth did not have pulpitis symptoms, abnormal mobility, or fistula. Radiographically, the tooth showed continued root formation or improved periapical conditions, the absence of prominent lesions, and no internal or external root resorption.
The contralateral sound molars from the same patients with VPT were screened and included as controls if they had (1) the baseline and at least one bitewing radiograph from routine check-ups, and (2) all required independent variables (age, sex, follow-up period, and root formation status).
Bitewing radiographs were excluded if the necessary reference points in Figure 1A, including the cementoenamel junction points on the distal and mesial external tooth surfaces, the highest point of the pulp chamber floor, and the highest point of the furcation of the tooth, were not identifiable by the primary investigator (AB).
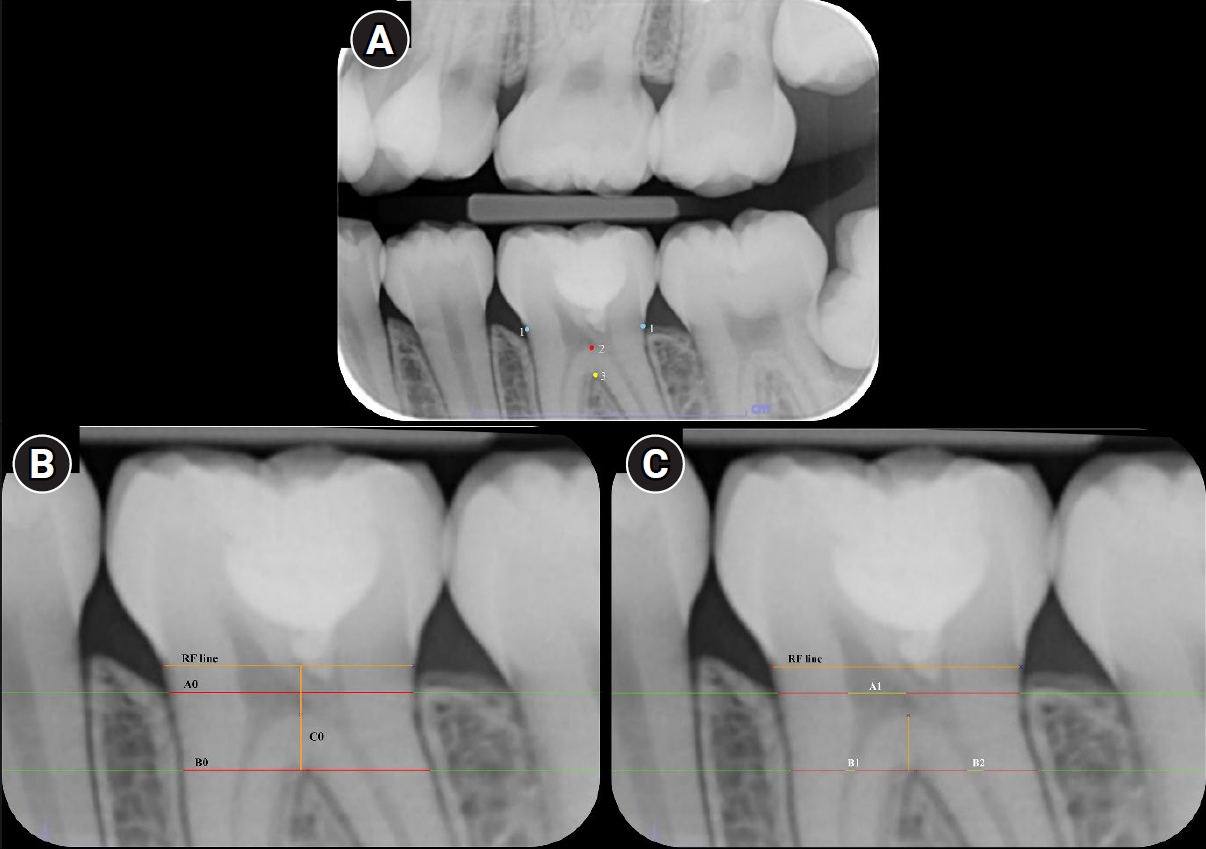
Reference points and lines on a bitewing radiograph used in this study. (A) Reference points: (1) blue points were the cementoenamel junction points on the distal and mesial external tooth surfaces; (2) a red point was the highest point of the pulp chamber floor; and (3) a yellow point was the highest point of the furcation. (B) Reference lines (RF line): the line connecting the mesial and distal cementoenamel junction points; B0 is a horizontal line/distance, paralleling to the RF line, between the mesial and the distal external root surfaces at the level of the fornix of furcation; C0 is the vertical and perpendicular line/distance between the RF line and the B0 line; A0 is the horizontal line/distance, paralleling to the RF line, between the mesial and the distal external root surfaces at the level of the occlusal one fourth of the C0 distance. (C) RF lines: A1 is the horizontal distance of pulp chamber from the mesial to the distal external pulp chamber surfaces at the level of the occlusal one fourth of the C0 distance; B1 is the horizontal distance of the mesial canal at the level of the fornix of furcation; B2 is the horizontal distance of the distal canal at the level of the fornix of furcation and C1 is the vertical distance between the floor of pulp chamber point and the fornix of furcation point.
Data collection and outcome
The bitewing radiographs that met the inclusion criteria were saved as JPEG files and then randomly placed into sets, each containing 25 radiographs. The blinded, calibrated examiners independently assessed each set of radiographs using the Chiang Mai University–Pulp Space Measurement (CMU–PSM) program on the same computer with the same settings in the same ambient environment. The evaluation duration was limited to 40 minutes per set.
To avoid discrepancies in radiographic image expansion or distortion, the semi-automated CMU–PSM program was specifically developed to linearly measure the pulp space using four pulp/tooth proportion values on bitewing radiographs. When using the CMU–PSM program, the evaluators manually selected the reference points in Figure 1A; the program then automatically created the reference lines in Figure 1B and C. The evaluator checked and manually adjusted the margin of the reference lines as appropriate. Finally, the CMU–PSM program automatically calculated four pulp/tooth proportion values, including pulp chamber width (A1/A0), pulp canal widths (mesial, B1/B0, and distal, B2/B0), and pulpal floor thickness (C1/C0). However, the A1/A0 value was not available for teeth treated with CP because their pulp chamber was completely occupied with pulp-dressing material. All pulp/tooth proportion values were exported to a Microsoft Excel table, and the change (∆) in these values from the baselines was computed as follows:
∆A1/A0 = A1/A0 (baseline) − A1/A0 (follow-up)
∆B1/B0 = B1/B0 (baseline) − B1/B0 (follow-up)
∆B2/B0 = B2/B0 (baseline) − B2/B0 (follow-up)
∆C1/C0 = C1/C0 (baseline) − C1/C0 (follow-up)
Sample size for reliability analyses was estimated with an online intraclass correlation coefficient (ICC) calculator (wnarifin.github.io/ssc/ssicc.html) [24] targeting an expected ICC of 0.80 with ± 0.10 precision at the 95% confidence level. This yielded required samples of 51 radiographs for intra-examiner reliability (two ratings per subject) and 29 radiographs for inter-examiner reliability. The radiographs were independently evaluated by four blinded evaluators (three faculty members and one master’s student in pediatric dentistry), with reassessment after a 2-week interval for intra-examiner reliability.
The primary investigator (AB) extracted all independent variables from patients’ charts. All values were derived from radiographic measurements performed by the calibrated independent evaluators. The dependent variables were the changes from baseline in four pulp/tooth proportion values (∆A1/A0, ∆B1/B0, ∆B2/B0, ∆C1/C0) assessed at each follow-up. In cases of total PCC, defined in this study as the complete radiographic absence of a discernible pulp space throughout the pulp chamber and root canal, quantitative measurements could not be performed, and these cases were recorded as total PCC.
The study addressed two main outcomes: (1) differences in changes of pulp space from baseline, by measuring the pulp/tooth proportion at different follow-ups between the VPT-treated and contralateral sound molars and (2) contributing factors associated with changes of the pulp space from baselines in the VPT-treated teeth.
Statistical methods
For intra-examiner reliability, the four pulp/tooth proportion values from the first and second measurements from each evaluator were analyzed using the ICC (two-way mixed model; type, single measurement; definition, absolute agreement). For inter-examiner reliability, the same four proportion values from all evaluators were analyzed using the ICC (two-way random model; type, single measure; definition, absolute agreement). ICCs were calculated using IBM SPSS ver. 19.0 (IBM Corp, Armonk, NY, USA), with an acceptable score set at 0.8 (good reliability), and scores above 0.9 considered excellent reliability [25].
Longitudinal missing data were handled using the last observation carried forward (LOCF) approach [26]. To evaluate the change in pulp/tooth proportion values from baseline, linear mixed-effects models were fitted, assuming a Gaussian distribution for the outcome. The models included fixed effects for treatment type (VPT vs. control), follow-up time (in months, modeled as a continuous variable with both linear and quadratic terms), and their interaction. Additional fixed covariates were included if they were potential confounders of the main determinants. To account for the hierarchical and longitudinal data structure, random effects were specified at the tooth level, with a random slope for time to model repeated measurements within each tooth. No additional patient-level random effects were included because each tooth represented the unit of analysis. Wald tests were applied to assess the statistical significance of associations between independent variables and each outcome at each follow-up time point. Stata software ver. 16.0 (StataCorp LLC, College Station, TX, USA) was used for analysis.
RESULTS
All ICC values were above 0.8 or 0.9, indicating good to excellent intra-and inter-examiner reliability.
Demographic data
Of 635 teeth from 400 patients, a total of 134 VPT-treated teeth from 131 patients, with 382 bitewing radiographs, met the inclusion criteria. The follow-up period ranged from 6 to 84 months (mean, 27.12 ± 17.67 months). Missing data amounted to 58.2% of the total. From the same patients who received VPT, 20 contralateral sound molars with 60 bitewing radiographs at different recall periods were included in the control group.
Demographic data of patients with VPT-treated teeth and the control group are summarized in Tables 1 and 2, respectively. Table 3 shows the incidence of total PCC, which was observed in 14/134 teeth (10.4%), involving a higher number of teeth with PP (7/134, 5.2%) and CP (6/134, 4.5%). Only one VPT failure was found in this total PCC group (1/14, 7.1%). This failed tooth also exhibited a fracture in the composite resin restoration.
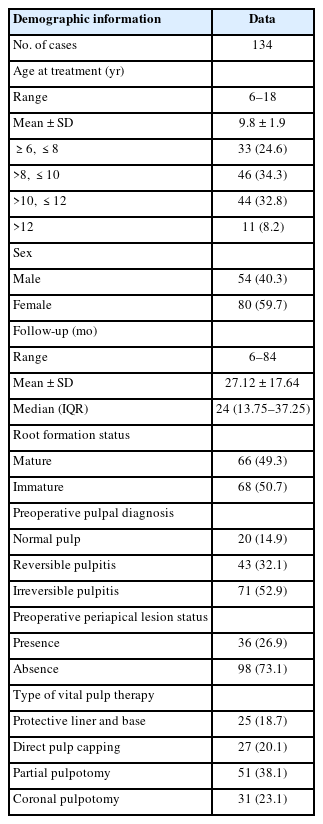
Demographic data of the study group with vital pulp therapy-treated teeth
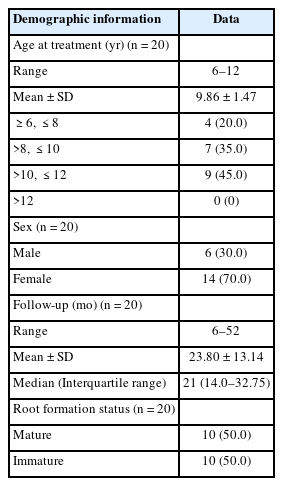
Demographic data of the control group
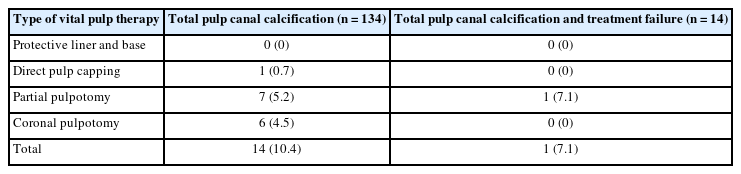
Incidence of total pulp canal calcification and failure rate from different types of vital pulp therapy
Comparison of the changes from baseline in pulp/tooth proportion values between molars with different types of vital pulp therapy and controls
Figure 2 illustrates the change from baseline in pulp/tooth proportion between teeth treated with different types of VPT and controls. A general trend of progressive decreases in all four pulp/tooth proportion values over time was observed. Notably, for ∆A1/A0, the proportion changes were significantly greater in the PP group compared to the control group at 12, 18, 24, 30, 36, and 48 months in Figure 2A. For ∆B1/B0, the changes were significantly greater in the CP group than in the controls at all times, except for 72 months in Figure 2B. For ∆B2/B0, the CP group also showed significantly greater change compared to the controls at all follow-up points in Figure 2C. In contrast, the changes in ∆C1/C0 of each VPT group were not significantly different from those of the control group at 6–60 months; however, the LB group displayed significantly lower change values than the controls at 72 months in Figure 2D. The fixed- and random-effects models for changes from baseline in pulp/tooth proportion values between teeth treated with different types of VPT and controls, including their marginal predictions and pairwise contrast p-values, are presented in Supplementary Tables 1–12.
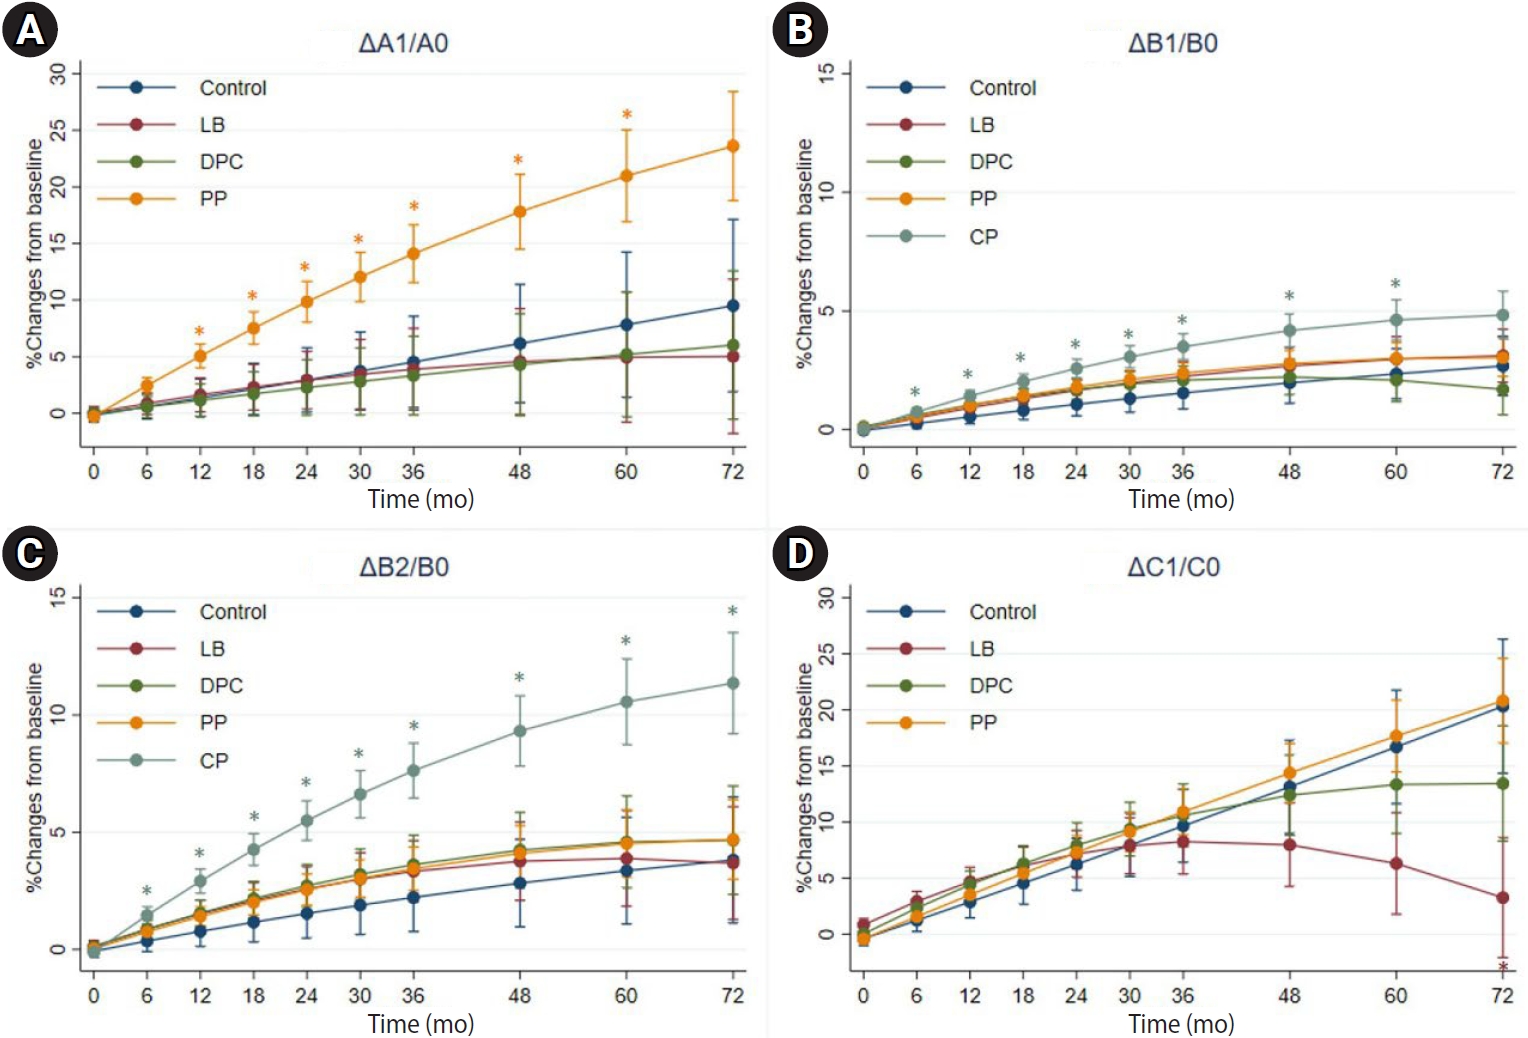
Comparison of the changes from baseline in pulp/tooth proportion values (A–D) between teeth treated with different types of vital pulp therapy and controls. LB, protective liner and base; DPC, direct pulp capping; PP, partial pulpotomy; CP, coronal pulpotomy. *p < 0.05, statistically significant.
Differences in the changes from baseline of pulp/tooth proportion values between the subgroups
The factors that contributed to significant differences between subgroups in change from baseline of pulp/tooth proportion values were VPT type and preoperative pulpal diagnosis.
Type of vital pulp therapy
Figure 3 illustrates changes from baseline in pulp/tooth proportion values in the DPC, PP, and CP groups against those in the LB group. Notably, for the ∆A1/A0 value, changes were significantly greater in the PP group than in the LB group at 12, 18, 24, 30, 36, 48, 60, and 72 months in Figure 3A. In contrast, the changes in ∆B1/B0 of the CP, PP, and DPC groups did not significantly differ from those of the LB group at any follow-up point in Figure 3B. Furthermore, for ∆B2/B0, decreases were significantly greater in the CP group than in the LB group at all follow-up points, except at 6 months (Figure 3C). Finally, for ∆C1/C0, decreases were significantly greater in the PP group than in the LB group at 60 and 72 months in Figure 3D. Figure 4 illustrates different magnitudes of pulp space narrowing over time in different types of VPT cases. The fixed- and random-effects models for changes from baseline in pulp/tooth proportion values (ΔA1/A0) in the DPC, PP, and CP groups compared with those in the LB group, including their marginal predictions and pairwise contrast p-values, are presented in Supplementary Tables 13–24.
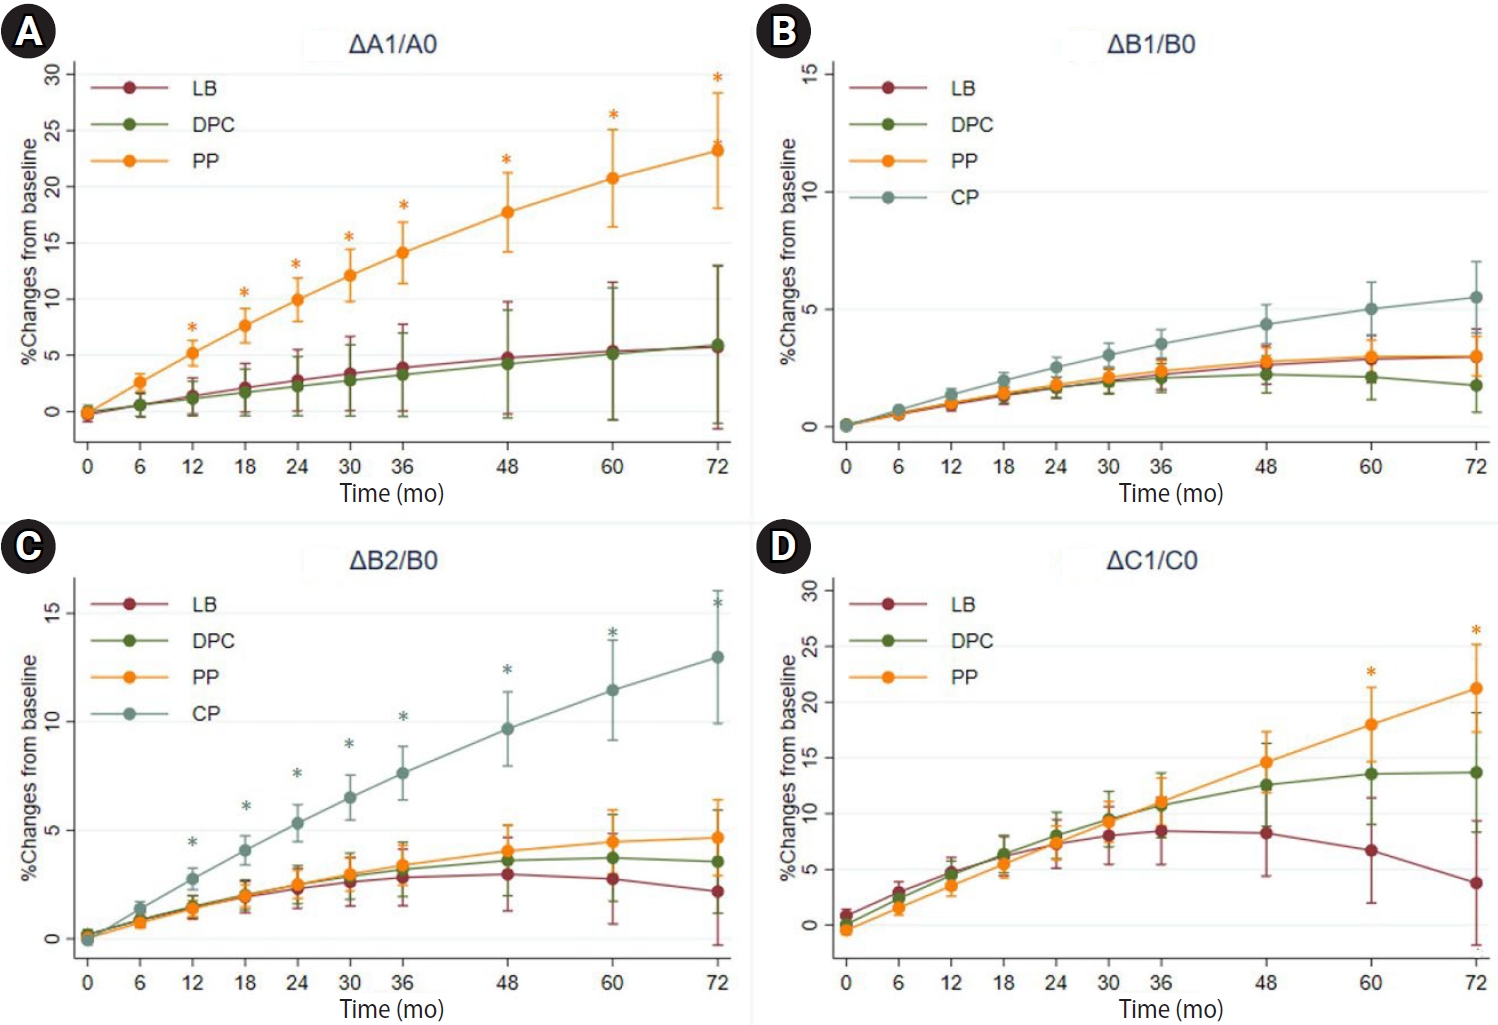
Comparison of the changes from baseline in pulp/tooth proportion values (A–D) in the DPC, PP, and CP groups against those in the LB group. LB, protective liner and base; DPC, direct pulp capping; PP, partial pulpotomy; CP, coronal pulpotomy. *p < 0.05, statistically significant.
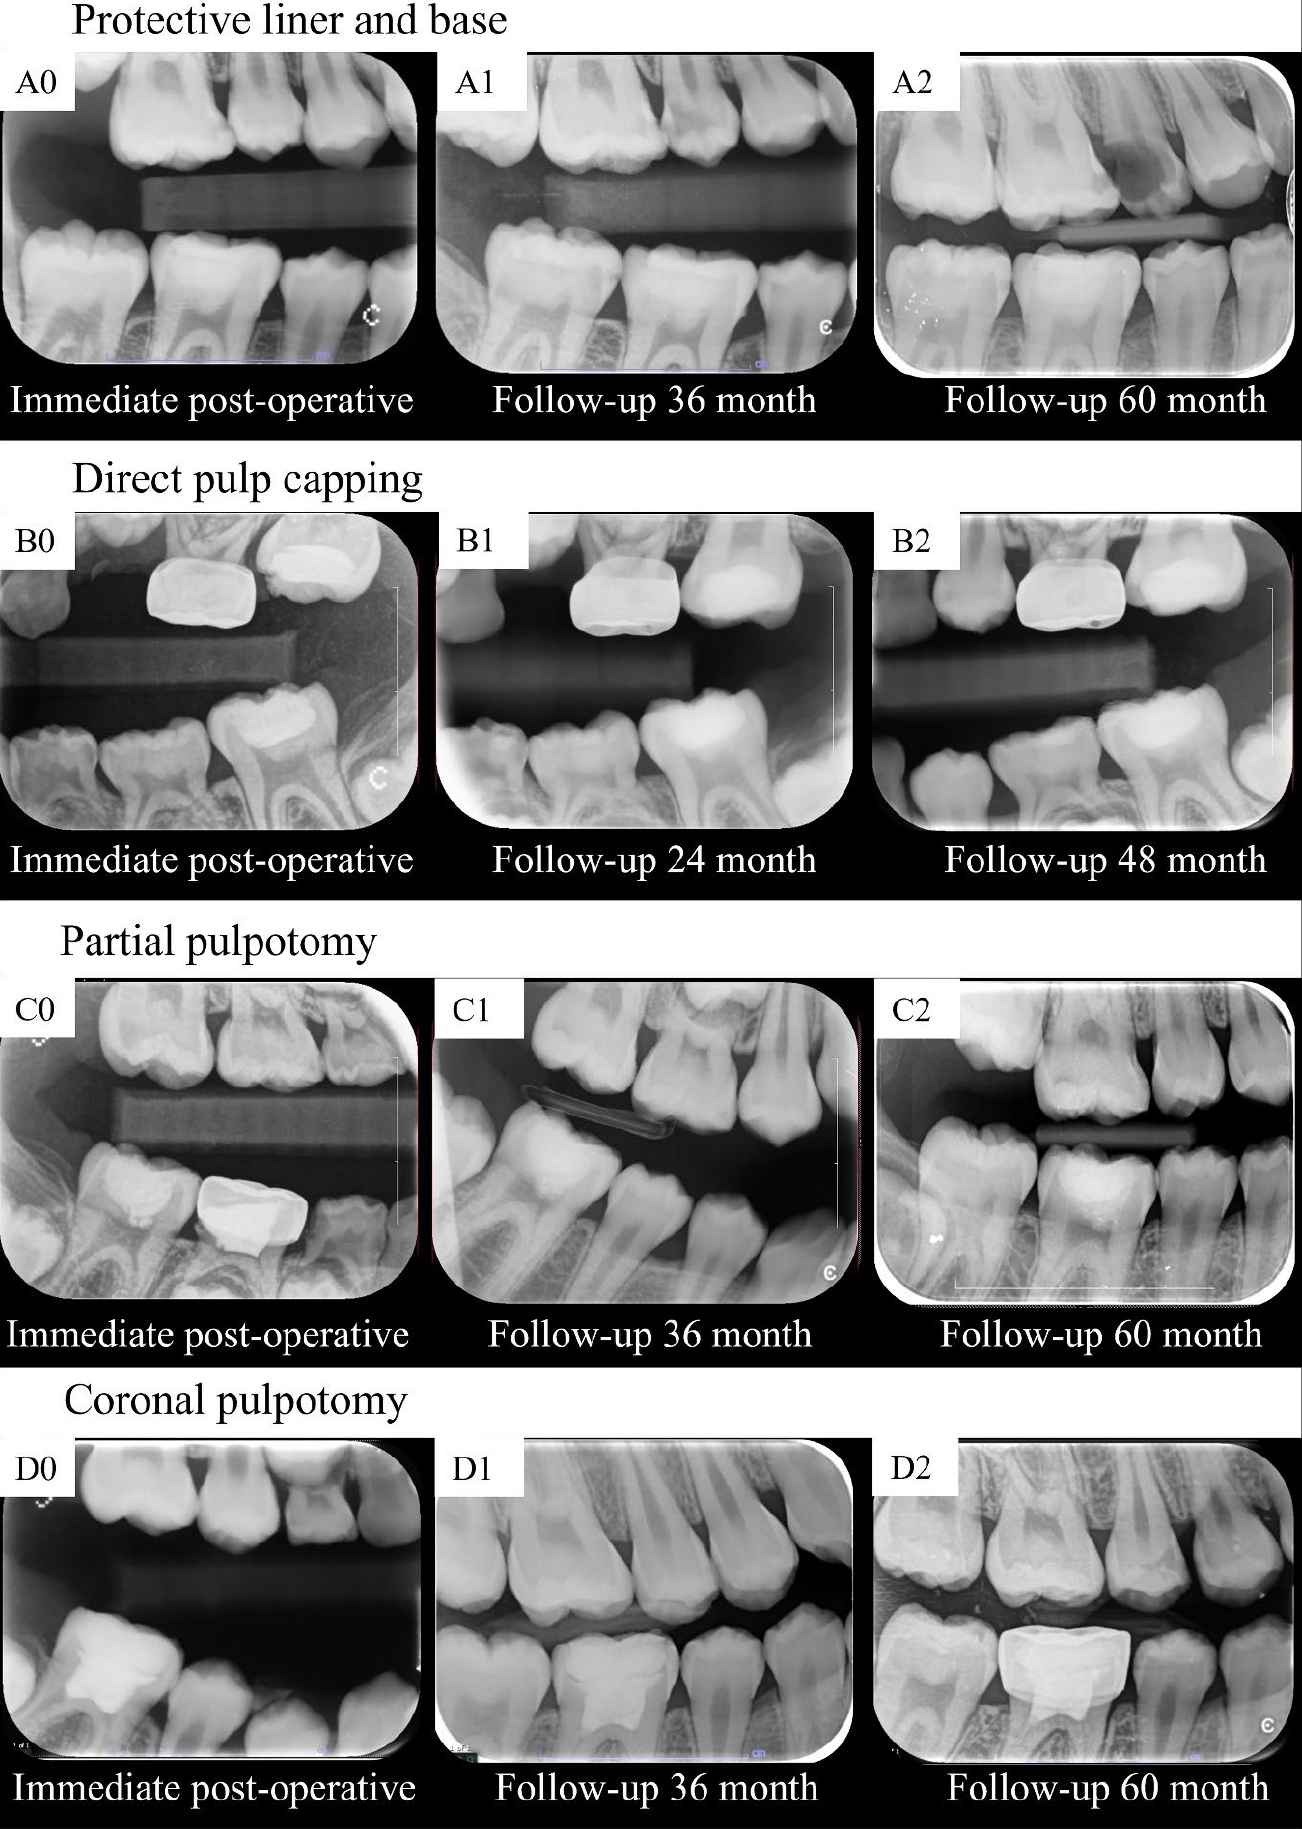
Radiographs demonstrate pulp space narrowing over time following different types of vital pulp therapy, a greater magnitude of pulp space narrowing was observed in teeth treated with partial and coronal pulpotomy.
Preoperative pulpal diagnosis
Figure 5 illustrates changes from baseline of pulp/tooth proportion values in the different groups of preoperative pulpal diagnosis, against the normal pulp group. For the ∆A1/A0 value, changes were significantly greater in the irreversible pulpitis group compared to the normal pulp group at 18, 24, 30, and 36 months in Figure 5A. The changes in ∆B1/B0 for the irreversible and reversible pulpitis groups did not differ significantly from those in the normal pulp group at any follow-up point in Figure 5B. For ∆B2/B0, the change was significantly greater in the irreversible pulpitis group compared to the normal pulp group at 72 months in Figure 5C. In terms of ∆C1/C0, the decreases in proportion were significantly greater in the irreversible pulpitis group than in the normal pulp group at 48, 60, and 72 months in Figure 5D. The fixed- and random-effects models for changes from baseline in pulp/tooth proportion values (ΔA1/A0) across different preoperative pulpal diagnosis groups, compared with the normal pulp group, including their marginal predictions and pairwise contrast p-values, are presented in Supplementary Tables 25–36.
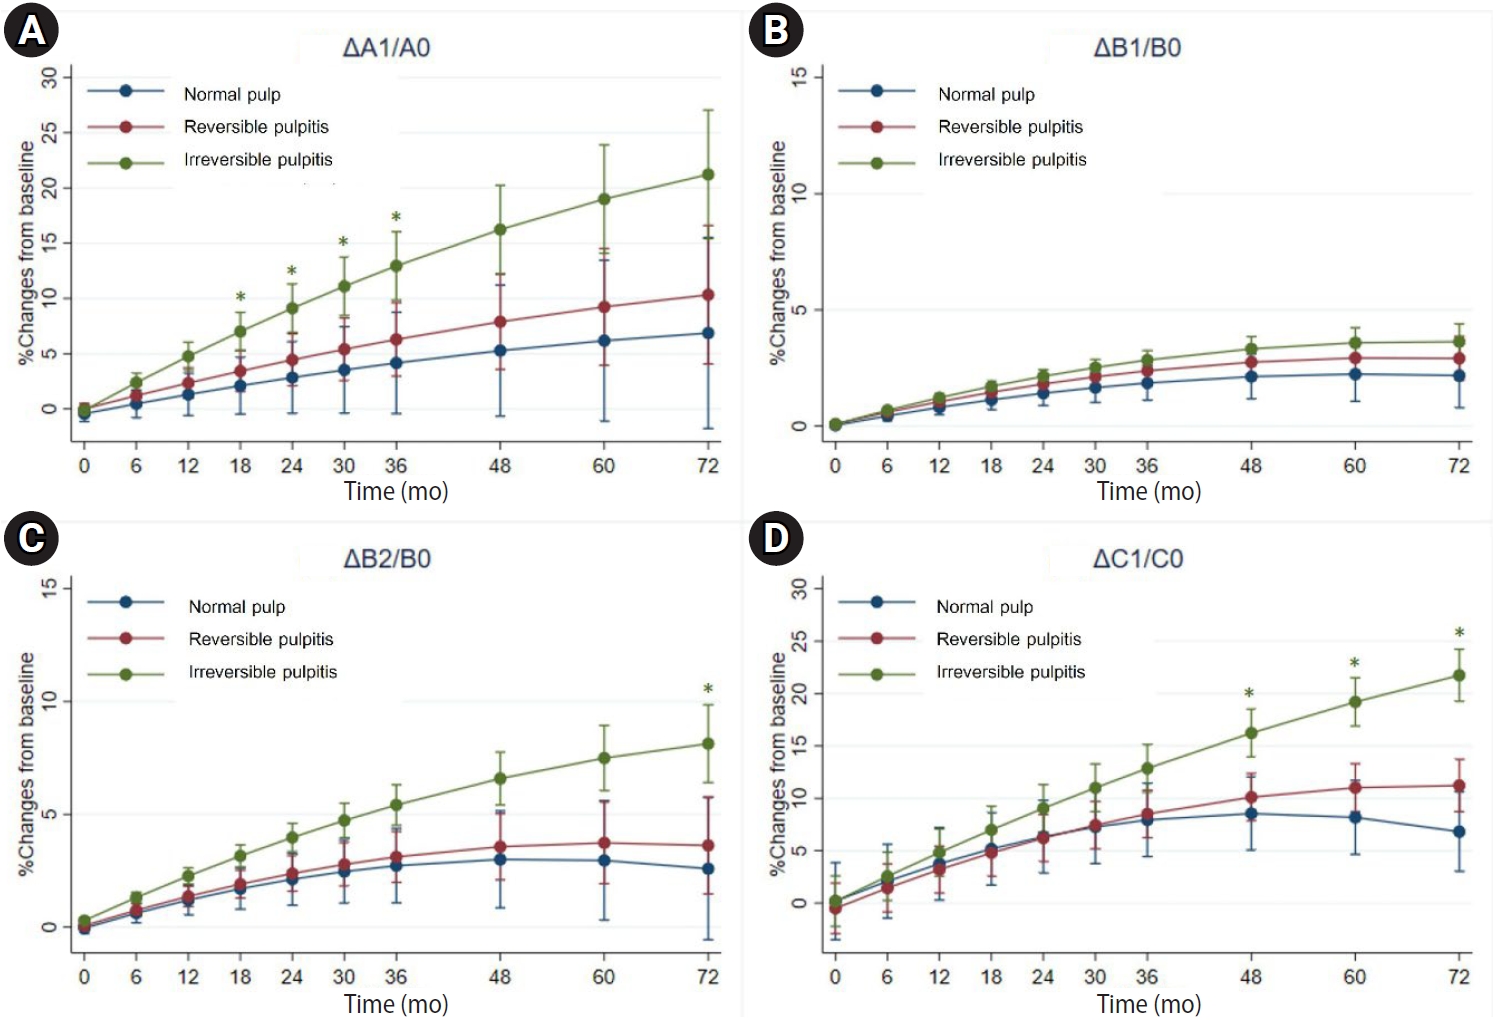
Comparison of the changes from baseline of pulp/tooth proportion values (A–D) in the different groups of preoperative pulpal diagnosis, against the normal pulp group. *p < 0.05, statistically significant.
DISCUSSION
To our knowledge, this study provides a longitudinal and objective evaluation of pulp space narrowing after VPT using pulp/tooth proportion analysis. Unlike previous reports that relied on subjective assessments at single time points, our approach quantified dimensional changes across follow-up periods. Distinct patterns of narrowing were observed. Pulp chamber width (∆A1/A0) decreased more prominently in teeth that underwent PP, while pulp canal width narrowing (∆B1/B0 and ∆B2/B0) was greater following CP. These findings highlight that the anatomical level of intervention influences the site of subsequent calcification. In addition, pulp space narrowing was associated with the invasiveness of the VPT procedure and with severe preoperative diagnoses, suggesting that both treatment factors and baseline pathology contribute to the calcification process. Clinically, this indicates the need for long-term radiographic monitoring, particularly in teeth treated with more extensive procedures, as excessive calcification may increase the complexity of future root canal treatment should it become necessary.
The observation that pulp space also narrows in sound molars aligns with physiological secondary dentin deposition in response to normal stimuli [27]. In sound teeth, secondary dentin deposition is age-dependent; Philippas [14] reported higher rates in younger individuals, with significant slowing at the root canal level after age 20 years. Our study population, aged 6–18 years, reflected this period of heightened activity, yet the differences between sound and treated teeth remained significant. Mechanisms of pulp space narrowing were previously explained for traumatized [28] and restored teeth [16]. Traumatic injuries can disrupt the blood supply, leading to reduced pulpal cellularity due to odontoblast destruction, with replacement by undifferentiated mesenchymal cells that deposit reparative dentin in an unregulated manner [28]. In restored teeth, calcification often occurs in the coronal pulp beneath restorations [16] or near sites of stimulation [29]. The severity of injury influences the rate of PCC, with tertiary dentin deposition occurring significantly faster than primary or secondary deposition [30]. Primary dentin is deposited at 4–8 µm/day until functional occlusion is achieved [31], after which secondary dentin deposition slows to 0.4 µm/day [32]. In contrast, tertiary dentin, often associated with severe injury or inflammation, can be deposited at rates of up to 3.5 µm/day [33].
The type of VPT and the preoperative pulpal diagnosis significantly influenced the magnitude of pulp space narrowing in this study. Our findings align with prior research indicating that more invasive treatments are associated with greater pulp space reduction [30]. The selection of VPT type often reflects the severity of pulpal injury and inflammation, with more extensively affected teeth receiving more invasive interventions [34]. Additionally, the larger contact area between the pulp tissue and pulp-dressing materials in PP and CP may promote the formation of a calcified barrier beneath the material, thereby increasing the likelihood of PCC [27]. This enhanced contact may also facilitate the release of growth factors involved in the calcification process [27]. However, the specific biological mechanisms linking different VPT procedures to PCC remain unclear and warrant further investigation.
In addition, the changes in proportion at the pulp canal width (∆B1/B0 and ∆B2/B0) indicated a similar trend between the distal and mesial roots; however, the change in proportion (∆B1/B0) in the mesial root showed no significant difference across VPT types. This lack of significant differences may be attributed to the smaller diameter of mesial roots compared to distal roots. In mandibular first molars, the distal root exhibits a greater pulp/tooth area ratio than the mesial root, as measured by cone-beam computed tomography (CBCT) [35]. Consequently, the smaller canal diameter in the mesial root may have obscured detectable changes in proportion at the orifice in our study.
Narrowing of the pulp space, typically resulting from PCC, was observed to increase over time in this study. This phenomenon has important clinical implications. Current management practices for PCC include either early endodontic treatment or continuous monitoring [8]. Although histological studies indicate that teeth with PCC do not exhibit pathological pulpal inflammation [9], the condition may nonetheless complicate future root canal procedures. Previous studies reported PCC incidences ranging from 0% to 45% [1–7], but only one documented pulp necrosis (5.8%) in teeth with complete PCC after CP [2]. In our study, only one out of 14 teeth with total PCC showed VPT failure (7.1%); this case involved a fractured restoration, complicating the attribution of failure specifically to PCC. Further research is needed to determine the true clinical impact of total PCC and establish evidence-based guidelines for the timing of endodontic intervention in VPT-treated teeth.
Although this study provides, to our knowledge, early insights into PCC and the narrowing of pulp space over time in VPT-treated teeth, it has some limitations. First, the retrospective design led to substantial data exclusion due to missing or poor-quality radiographs. Second, the limited diversity of irrigants and pulp-dressing materials, along with the narrow age range of participants, may affect generalizability. Third, the CMU–PSM program used for pulp/tooth proportion measurement is constrained by its reliance on two-dimensional measurements. While CBCT and histological techniques offer more accurate assessments [9,36,37], they are less practical for clinical use due to cost, accessibility, and higher radiation exposure [38]. Thirdly, although 58.2% of the data were missing, the trends observed in the raw data were consistent with those obtained using the LOCF method, supporting the reliability of this imputation approach. While LOCF is generally suboptimal due to its assumption of no further change, its use was considered reasonable here given the gradual and biologically plausible progression of pulp/tooth proportion values over time. Lastly, formal simulation-based power estimation was not conducted because it would have required assumptions about unknown parameters; therefore, some residual uncertainty in statistical precision cannot be completely excluded. Future prospective studies with larger and more diverse samples are needed to confirm these findings and improve methodological robustness.
CONCLUSIONS
This study observed that the molars treated with VPT tended to exhibit a greater magnitude of pulp space narrowing over time compared with the contralateral sound molars. The degree of narrowing appeared to be associated with the invasiveness of the VPT procedure and the severity of the preoperative pulpal diagnosis. These observations may provide information that clinicians could consider when interpreting long-term pulpal changes following VPT; however, further prospective studies are needed to better elucidate the clinical significance of these findings and to inform appropriate monitoring or management approaches.
Notes
CONFLICT OF INTEREST
No potential conflict of interest relevant to this article was reported.
FUNDING/SUPPORT
This study was financially supported by the Research Fund for Postgraduate Students of the Faculty of Dentistry, Chiang Mai University.
ACKNOWLEDGMENTS
The authors would like to thank Dr. Boonchanit Nophachatsathid, a former master’s student in pediatric dentistry, for contributing to the measurement of the pulp space.
AUTHOR CONTRIBUTIONS
Conceptualization, Investigation: Boontankun A, Chompu-inwai P, Manmontri C, Chaipattanawan N. Data curation: Boontankun A, Chompu-inwai P, Manmontri C, Chaipattanawan N, Phinyo P. Formal analysis: Boontankun A, Phinyo P. Funding acquisition: Boontankun A, Chompu-inwai P. Methodology: All authors. Project administration: Boontankun A. Resources: Chompu-inwai P. Software: Thaiupathump T. Supervision: Chompu-inwai P. Validation: Boontankun A, Chompu-inwai P, Phinyo P, Nirunsittirat A. Visualization: Boontankun A, Chompu-inwai P. Writing - original draft: Boontankun A, Chompu-inwai P. Writing - review & editing: All authors. All authors read and approved the final manuscript.
DATA SHARING STATEMENT
The datasets are not publicly available but are available from the corresponding author upon reasonable request.
SUPPLEMENTARY MATERIALS
Supplementary Table 1.
Fixed and random-effects model for the changes from baseline in pulp/tooth proportion values (△A1/A0) between teeth treated with different types of VPT and controls
Supplementary Table 2.
Marginal predicted values of the fixed and random-effects model for the changes from baseline in pulp/tooth proportion values (△A1/A0) between teeth treated with different types of VPT and controls
Supplementary Table 3.
Bonferroni-adjusted p-values for contrasts of the marginal predicted values of the fixed and random-effects model for the changes from baseline in pulp/tooth proportion values (△A1/A0) between teeth treated with different types of VPT and controls
Supplementary Table 4.
Fixed and random-effects model for the changes from baseline in pulp/tooth proportion values (△B1/B0) between teeth treated with different types of VPT and controls
Supplementary Table 5.
Marginal predicted values of the fixed and random-effects model for the changes from baseline in pulp/tooth proportion values (△B1/B0) between teeth treated with different types of VPT and controls
Supplementary Table 6.
Bonferroni-adjusted p-values for contrasts of the marginal predicted values of the fixed and random-effects model for the changes from baseline in pulp/tooth proportion values (△B1/B0) between teeth treated with different types of VPT and controls
Supplementary Table 7.
Fixed and random-effects model for the changes from baseline in pulp/tooth proportion values (△B2/B0) between teeth treated with different types of VPT and controls
Supplementary Table 8.
Marginal predicted values of the fixed and random-effects model for the changes from baseline in pulp/tooth proportion values (△B2/B0) between teeth treated with different types of VPT and controls
Supplementary Table 9.
Bonferroni-adjusted p-values for contrasts of the marginal predicted values of the fixed and random-effects model for the changes from baseline in pulp/tooth proportion values (△B2/B0) between teeth treated with different types of VPT and controls
Supplementary Table 10.
Fixed and random-effects model for the changes from baseline in pulp/tooth proportion values (△C1/C0) between teeth treated with different types of VPT and controls
Supplementary Table 11.
Marginal predicted values of the fixed and random-effects model for the changes from baseline in pulp/tooth proportion values (△C1/C0) between teeth treated with different types of VPT and controls
Supplementary Table 12.
Bonferroni-adjusted p-values for contrasts of the marginal predicted values of the fixed and random-effects model for the changes from baseline in pulp/tooth proportion values (△C1/C0) between teeth treated with different types of VPT and controls
Supplementary Table 13.
Fixed and random-effects model for the changes from baseline in pulp/tooth proportion values (△A1/A0) in the DPC, PP, and CP groups against those in the LB group
Supplementary Table 14.
Marginal predicted values of the fixed and random-effects model for the changes from baseline in pulp/tooth proportion values (△A1/A0) in the DPC, PP, and CP groups against those in the LB group
Supplementary Table 15.
Bonferroni-adjusted p-values for contrasts of the marginal predicted values of the fixed and random-effects model for the changes from baseline in pulp/tooth proportion values (△A1/A0) in the DPC, PP, and CP groups against those in the LB group
Supplementary Table 16.
Fixed and random-effects model for the changes from baseline in pulp/tooth proportion values (△B1/B0) in the DPC, PP, and CP groups against those in the LB group
Supplementary Table 17.
Marginal predicted values of the fixed and random-effects model for the changes from baseline in pulp/tooth proportion values (△B1/B0) in the DPC, PP, and CP groups against those in the LB group
Supplementary Table 18.
Bonferroni-adjusted p-values for contrasts of the marginal predicted values of the fixed and random-effects model for the changes from baseline in pulp/tooth proportion values (△B1/B0) in the DPC, PP, and CP groups against those in the LB group
Supplementary Table 19.
Fixed and random-effects model for the changes from baseline in pulp/tooth proportion values (△B2/B0) in the DPC, PP, and CP groups against those in the LB group
Supplementary Table 20.
Marginal predicted values of the fixed and random-effects model for the changes from baseline in pulp/tooth proportion values (△B2/B0) in the DPC, PP, and CP groups against those in the LB group
Supplementary Table 21.
Bonferroni-adjusted p-values for contrasts of the marginal predicted values of the fixed and random-effects model for the changes from baseline in pulp/tooth proportion values (△B2/B0) in the DPC, PP, and CP groups against those in the LB group
Supplementary Table 22.
Fixed and random-effects model for the changes from baseline in pulp/tooth proportion values (△C1/C0) in the DPC, PP, and CP groups against those in the LB group
Supplementary Table 23.
Marginal predicted values of the fixed and random-effects model for the changes from baseline in pulp/tooth proportion values (△C1/C0) in the DPC, PP, and CP groups against those in the LB group
Supplementary Table 24.
Bonferroni-adjusted p-values for contrasts of the marginal predicted values of the fixed and random-effects model for the changes from baseline in pulp/tooth proportion values (△C1/C0) in the DPC, PP, and CP groups against those in the LB group
Supplementary Table 25.
Fixed and random-effects model for the changes from baseline of pulp/tooth proportion values (△A1/A0) in the different groups of pre-operative pulpal diagnosis, against the normal pulp group
Supplementary Table 26.
Marginal predicted values of the fixed and random-effects model for the changes from baseline of pulp/tooth proportion values (△A1/A0) in the different groups of pre-operative pulpal diagnosis, against the normal pulp group
Supplementary Table 27.
Bonferroni-adjusted p-values for contrasts of the marginal predicted values of the fixed and random-effects model for the changes from baseline of pulp/tooth proportion values (△A1/A0) in the different groups of pre-operative pulpal diagnosis, against the normal pulp group
Supplementary Table 28.
Fixed and random-effects model for the changes from baseline of pulp/tooth proportion values (△B1/B0) in the different groups of pre-operative pulpal diagnosis, against the normal pulp group
Supplementary Table 29.
Marginal predicted values of the fixed and random-effects model for the changes from baseline of pulp/tooth proportion values (△B1/B0) in the different groups of pre-operative pulpal diagnosis, against the normal pulp group
Supplementary Table 30.
Bonferroni-adjusted p-values for contrasts of the marginal predicted values of the fixed and random-effects model for the changes from baseline of pulp/tooth proportion values (△B1/B0) in the different groups of pre-operative pulpal diagnosis, against the normal pulp group
Supplementary Table 31.
Fixed and random-effects model for the changes from baseline of pulp/tooth proportion values (△B2/B0) in the different groups of pre-operative pulpal diagnosis, against the normal pulp group
Supplementary Table 32.
Marginal predicted values of the fixed and random-effects model for the changes from baseline of pulp/tooth proportion values (△B2/B0) in the different groups of pre-operative pulpal diagnosis, against the normal pulp group
Supplementary Table 33.
Bonferroni-adjusted p-values for contrasts of the marginal predicted values of the fixed and random-effects model for the changes from baseline of pulp/tooth proportion values (△B2/B0) in the different groups of pre-operative pulpal diagnosis, against the normal pulp group
Supplementary Table 34.
Fixed and random-effects model for the changes from baseline of pulp/tooth proportion values (△C1/C0) in the different groups of pre-operative pulpal diagnosis, against the normal pulp group
Supplementary Table 35.
Marginal predicted values of the fixed and random-effects model for the changes from baseline of pulp/tooth proportion values (△C1/C0) in the different groups of pre-operative pulpal diagnosis, against the normal pulp group
Supplementary Table 36.
Bonferroni-adjusted p-values for contrasts of the marginal predicted values of the fixed and random-effects model for the changes from baseline of pulp/tooth proportion values (△C1/C0) in the different groups of pre-operative pulpal diagnosis, against the normal pulp group