Effects of zinc oxide and calcium–doped zinc oxide nanocrystals on cytotoxicity and reactive oxygen species production in different cell culture models
Article information
Abstract
Objectives
This study aimed to synthesize nanocrystals (NCs) of zinc oxide (ZnO) and calcium ion (Ca2+)-doped ZnO with different percentages of calcium oxide (CaO), to evaluate cytotoxicity and to assess the effects of the most promising NCs on cytotoxicity depending on lipopolysaccharide (LPS) stimulation.
Materials and Methods
Nanomaterials were synthesized (ZnO and ZnO:xCa, x = 0.7; 1.0; 5.0; 9.0) and characterized using X-ray diffractometry, scanning electron microscopy, and methylene blue degradation. SAOS-2 and RAW 264.7 were treated with NCs, and evaluated for viability using the MTT assay. NCs with lower cytotoxicity were maintained in contact with LPS-stimulated (+LPS) and nonstimulated (−LPS) human dental pulp cells (hDPCs). Cell viability, nitric oxide (NO), and reactive oxygen species (ROS) production were evaluated. Cells kept in culture medium or LPS served as negative and positive controls, respectively. One-way analysis of variance and the Dunnett test (α = 0.05) were used for statistical testing.
Results
ZnO:0.7Ca and ZnO:1.0Ca at 10 µg/mL were not cytotoxic to SAOS-2 and RAW 264.7. +LPS and −LPS hDPCs treated with ZnO, ZnO:0.7Ca, and ZnO:1.0Ca presented similar NO production to negative control (p > 0.05) and lower production compared to positive control (p < 0.05). All NCs showed reduced ROS production compared with the positive control group both in +LPS and −LPS cells (p < 0.05).
Conclusions
NCs were successfully synthesized. ZnO, ZnO:0.7Ca and ZnO:1.0Ca presented the highest percentages of cell viability, decreased ROS and NO production in +LPS cells, and maintenance of NO production at basal levels.
INTRODUCTION
Vital pulpal therapy (VPT) is an alternative to endodontic treatment to maintain pulpal vitality [1]. This technique preserves the vitality of the remaining pulp and promotes the formation of new dentin to cover the exposed pulp. In clinical practice, the term VPT is used to describe direct or indirect pulp capping procedures, in which a cover material is applied to the exposed pulp or dentin, respectively, or pulpotomy, which involves removal of the coronary pulp followed by direct coverage of the remaining pulp tissue [1].
Nanotechnology has enabled the production of dental materials on a nanometric scale, with improved physicochemical properties. The development of nanoparticles (NPs) for medical purposes has been widely investigated, since when the size is greatly reduced at the nanometric scale, the surface-to-volume ratio increases, which generates new and interesting properties, such as a greater ability to absorb drugs, probes, and proteins [234]. In addition to size and shape, crystalline NPs show alterations in both physical and biological properties [5]. The size reduction provides better bioavailability in comparison to bulk material, improving the absorption of NPs in biological systems [67]. However, nanomaterials can interact with cellular components and induce cytotoxic effects, since proteins and cellular components range in size between 5 and 50 nm [8].
Zinc oxide (ZnO) has been widely used as an endodontic filling material [9] and in pulpotomy [10] for primary teeth. ZnO has been shown, in its natural form, to reduce the activity of a wide variety of bacteria [11], and its NP form improves its profile [12]. One strategy to change the properties of NPs and, therefore, their environmental implications, is the doping technique [13]. Doping involves the intentional modification of the composition of NPs by the addition of dopants (impurities), with the intention of improving their functionality or reducing undesirable properties [1415]. Many agents have been suggested for the doping of ZnO NPs [14]. Among them, calcium doping of ZnO (ZnO:Ca) has been shown to attenuate strain in the cell unit [16] and to improve antibacterial activity [1417]. Considering that calcium hydroxide (Ca(OH)2) is a regenerative material that is widely used in VPT to induce the formation of mineralized tissue, it would be interesting to evaluate the association between calcium and ZnO in the NP form using the doping technique.
In this study, pure ZnO and Ca2+-doped ZnO (ZnO:xCa) nanocrystals (NCs) were synthesized with different percentages of Ca2+ by weight (x = 0.7%; 1.0%; 5.0%; 9.0%), and the chemistry and physical properties and cytotoxicity were assessed in a human osteosarcoma cell line (SAOS-2) and a leukemia macrophage murine cell line (RAW 264.7). Subsequently, the NCs that provided the most promising results were placed in contact with human dental pulp cells (hDPCs) that were stimulated or nonstimulated with lipopolysaccharide (LPS) to evaluate the cytotoxic effects and modulatory capacity of reactive oxygen species (ROS) production by these cells. The null hypothesis was that the different NCs tested would not affect SAOS-2, RAW 264.7, and hDPC responses.
MATERIALS AND METHODS
Synthesis and characterization of nanocomposites of Ca-doped ZnO and calcium oxide (CaO) NCs
ZnO NCs were synthesized via coprecipitation based on Silva et al. [14]. The Ca2+-doped ZnO nanocomposites were synthesized by coprecipitation using a solution of calcium chloride (≥ 99.9%) (Sigma-Aldrich, St. Louis, MO, USA) in a concentration of x wt. % Ca in relation to zinc (x = 0.7%; 1.0%; 5.0%; 9.0%) during the reaction of ZnO NCs [14]. X-ray diffractometry (XRD) measurements were performed on a SHIMATZU diffractometer XDR-6000 operated at 20 kV and 2 mA with CuK radiation (λ = 1.5406 Å) in the powder samples. Scanning electron microscopy (SEM) images were obtained using an electronic microscope with energy dispersive X-ray spectrometry (EDS) (Zeiss EVO MA10, Carl Zeiss, Oberkochen, Germany) of the powder samples. The photocatalytic activity of the samples was tested by the degradation of methylene blue (MB) under artificial light irradiation, with a 300 W Xenon lamp as the light source. In detail, 8 mg of photocatalyst was added to 50 mL of MB solution (0.02 mmol/L) in a cylindrical reactor. A magnetic stirrer was used to ensure the homogeneous dispersion of the photocatalyst during the reaction. The photocatalytic reactor was positioned 15 cm below the light source, and the photocatalytic reaction was initiated by adding the catalyst into the reactor and switching on the lamp. At controlled intervals, 1.0 mL suspensions were collected for analysis. Adsorption experiments were conducted under the same conditions but without xenon light irradiation. The MB concentration was measured using an ultraviolet-visible-near- infrared (UV-VIS-NIR) spectrophotometer (Shimadzu, Kyoto, Japan) at a wavelength of 663 nm. The percentage of discoloration was calculated using the following formula: % Discoloration = 1 − (A/Ao) × 100 (1), where A is the absorbance of the solution at time (t) > 0, and Ao is the initial absorbance.
RAW 264.7/SAOS-2 cell culture and nanocomposite treatment
RAW 264.7 and SAOS-2 were obtained from the Cell Bank of Rio de Janeiro (Rio de Janeiro, RJ, Brazil). Cells were cultured until confluence in Dulbecco's Modified Eagle's Medium (DMEM) (Vitrocell Embriolife, Campinas, SP, Brazil) supplemented with 10% heat-inactivated fetal bovine serum (FBS) (Gibco, Langley, OK, USA) and 1% penicillin-streptomycin (Sigma-Aldrich), in a humid atmosphere of 5% CO2 and 37°C. RAW 264.7 and SAOS-2 cells were plated in quintuplicate in 96-well plates (Costar Corp., Cambridge, MA, USA) (2 × 10⁴ cells/well) and allowed to adhere overnight. The cells were then stimulated with autoclaved solutions of (a) ZnO, (b) ZnO:0.7Ca, (c) ZnO:1.0Ca, (d) ZnO:5.0Ca and (e) ZnO:9.0Ca at concentrations of 10 μg/mL, 50 μg/mL, and 100 μg/mL in fresh medium for 24 hours. The control group contained cells maintained in culture medium (DMEM). After the incubation period, the cells were prepared for cell viability analysis by the MTT formazan viability assay. This study was repeated twice using 5 samples for each group at every time point.
hDPC cell culture
Primary hDPC cultures were donated from the Faculty of Dentistry of the Federal University of Uberlândia (Ethics Committee protocol number 2019/54488816.2.0000.5152). Two healthy primary molar teeth (n = 2) were collected from 2 patients (2 males aged 10–11) after their guardians signed the informed consent form. The teeth were collected, placed inside a Falcon tube with DMEM (Vitrocell Embriolife) and immediately taken to the Biomaterials and Cell Biomaterials Laboratory. The pulp was extracted from the interior of the pulp chamber using a previously sterilized sharp dentin spoon and immersed for 1 hour in a solution of 3 mg/mL collagenase type I (Sigma-Aldrich) and 4 mg/mL dispase (Sigma-Aldrich). The solution was centrifuged at 1,200 rpm for 2 minutes and resuspended in basal medium. The obtained cells were plated in 25 cm2 flasks and cultivated using DMEM (Vitrocell Embriolife) supplemented with 10% heat-inactivated FBS (Gibco) and 1% penicillin-streptomycin (Sigma-Aldrich). The cells were incubated for 4 days in a humid atmosphere of 5% CO2 and 37°C. The culture medium was first replaced after 3 days of incubation, and thereafter, it was changed twice a week. The cells were expanded up to the fourth passage, stored in cryogenic medium of FBS and 10% dimethyl sulfoxide (DMSO) (LGC Biotecnologia, Cotia, SP, Brazil), and frozen in liquid nitrogen for later experimental use [18].
hDPCs lipopolysaccharide-induced stress and NC treatment
The working concentration for use in hDPC cultures was established based on the best results regarding cell viability obtained in preliminary tests using SAOS-2 and RAW 264.7. Cells were cultured until confluence in DMEM (Vitrocell Embriolife) supplemented with 10% heat-inactivated FBS (Gibco) and 1% penicillin-streptomycin (Sigma-Aldrich), in a humid atmosphere of 5% CO2 and 37°C. hDPCs were plated in quintuplicate in 96-well plates (Costar Corp.) (2 × 10⁴ cells/well) and allowed to adhere overnight. In half of the samples, the culture medium was replaced with DMEM (Vitrocell Embriolife) without FBS, and the cells were stimulated with the autoclaved (a) ZnO, (b) ZnO:0.7Ca, and (c) ZnO:1.0Ca solutions at concentrations of 10 μg/mL (cells without stimulation of LPS: −LPS). The remaining samples were incubated with the NCs and LPS (LPS, ultra-pure grade, Escherichia coli O111: B4, Invitrogen, San Diego, CA, USA) at a concentration of 10 µg/mL (cells with stimulation of LPS: +LPS group) [18]. The control group contained cells maintained in culture medium (DMEM). After an incubation period of 24 hours, the cells were immediately subjected to the MTT formazan assays and measurements of the production of nitric oxide (NO) and ROS. This study was repeated twice using 5 samples for each group at every time point.
Cell viability assay
In all cell models, the cell viability was evaluated 24 hours after the treatment with NCs. MTT solution (Sigma-Aldrich) (5 mg/mL) was added to each well, and cells were incubated at 37°C for 4 hours. The supernatant was removed, and then 100 μL of DMSO (LGC Biotecnologia) was added. The optical density at 570 nm was then measured using a microplate reader (Biochrom, Cambridge, UK). The absorbance value readings were normalized to those of untreated control cultures (DMEM-100%), and differences between the mean values were statistically analyzed.
NO production
NO production in the cell culture supernatants of hDPCs was quantified spectrophotometrically 24 hours after the treatment with the NCs and stimulation with LPS, using the diazotization reaction with Griess reagent. In this method, nitrite is first treated with sulfanilamide in acidic medium, followed by the addition of N-naphthyl-ethylenediamine. In a 96-well plate, 100-µL aliquots of the supernatant of each sample were plated in quintuplicate with the same quantity of Griess reagent. After 10 minutes of incubation at ambient temperature protected from light, the absorbance was determined in a microplate reader with a 540 nm filter. The absorbance of this reaction at 540 nm is linearly proportional to the nitrite concentration in the samples. The positive control group contained LPS-stimulated cells without treatment, and the negative control group contained cells maintained in DMEM (no LPS stimulation).
ROS production
ROS production was quantified and evaluated qualitatively by means of the fluorescent oxidant-sensing probe 2′,7′-dichlorodihydrofluorescein diacetate (DCFH-DA, Invitrogen). After a 24-hour incubation period with the NCs and stimulation with LPS, the medium was removed, and a solution containing the fluorescent probe in PBS (5 µmol/L) was added (200 µL). After 5 minutes, inflammatory mediator expression was measured using a multimode plate reader (GloMax® Discover Multimode Microplate Reader, Promega, São Paulo, SP, Brazil). In the qualitative analyses, the samples were plated on 24-well plates (105 cells/well) in the bottom of the compartments, and the same protocol was followed. After 24 hours, the culture medium was removed, and the samples were analyzed and photographed by fluorescence microscopy (Invitrogen Evos FL Imaging System, Invitrogen). The value readings were normalized to LPS control cultures (LPS-100%), and the differences between mean values were statistically analyzed. The positive control group contained LPS-stimulated and untreated cells, and the negative control group contained cells maintained in DMEM (no LPS stimulation).
Statistical analysis
All data were analyzed for normality using the Kolmogorov–Smirnov test. One-way analysis of variance and the Tukey test were used to compare data between the treated groups. The Dunnett test was used to compare the experimental groups with the control group. Statistical significance was set at α = 0.05. Statistical analysis was performed using GraphPad Prism 6 software (GraphPad, La Jolla, CA, USA).
RESULTS
Characterization of the nanocomposite
The changes in the crystal lattice in terms of the type and percentage of crystals were evaluated by X-ray diffractograms of the samples, as shown in Figure 1. The X-ray diffractograms showed Bragg diffraction peaks characteristic of ZnO in the wurtzite structure (JCPDS: 36-1451), confirming the formation of ZnO NCs (Figure 1A). With increasing concentrations of Ca, we observed a shift in the diffraction peak (100) to smaller angles (Figure 1B). This displacement was related to the substitutional incorporation of the Zn2+ by Ca2+ ions in the crystalline structure of ZnO, since the ionic radius of Ca2+ (0.99 Å) is larger than that of Zn2+ (0.74 Å). Moreover, the presence of Bragg diffraction peaks characteristic of CaO NCs (JCPDS: 00-037-1497) were observed beginning at the 0.7Ca concentration and intensified with increasing Ca concentrations in the samples, from 3.8% to 6.7% for samples from 0.7% to 9.0% Ca (Figure 1C). Figure 1C illustrates samples in which CaO NCs formed as nanocomposites (Ca-doped ZnO + CaO NCs).
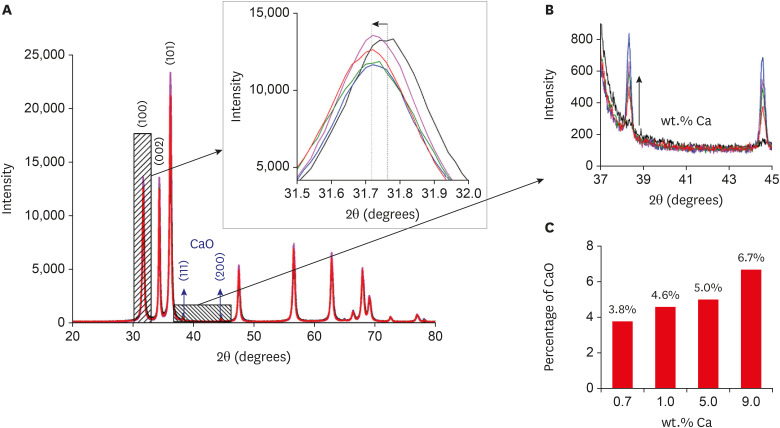
X-ray diffractograms of the zinc oxide (ZnO):calcium (xCa) nanocrystals. X-ray diffraction patterns of pure and Ca-doped ZnO nanocrystals (A), variation in angular distance confirming the incorporation of Ca2+ ions into ZnO nanocrystals (B), calcium oxide (CaO) nanocrystal patterns observed in 0.7 wt.% Ca (C), increase in the concentration of CaO with Ca doping, from 3.8% to 6.7% for the 0.7 to 9.0 wt.% samples (C).
The incorporation of ions into the crystalline structure can change the morphology, so the morphological properties of the samples were investigated by SEM with EDS (Figure 2). The SEM images showed greater quantities of ZnO NCs (Figure 2A) with a spherical morphology, with a few NCs exhibiting a rod shape. However, the incorporation of Ca into the ZnO structure favored an increased length of the rod shape (Figure 2B-E). The rod length was 160, 200, 300, 400, and 350 nm in the samples of pure ZnO and ZnO with 0.7% Ca, 1.0% Ca, 5.0% Ca, and 9.0% Ca, respectively. This result indicates that Ca2+ ions were being incorporated into the sides of the crystal to favor growth in length. Regarding diameter, the following values were obtained: 50 nm (ZnO), 30 nm (0.7% Ca), and 20 nm (1.0% Ca), and the same values were maintained for the samples of 5.0% and 9.0% Ca. These results reinforce the XRD findings (Figure 1), confirming the incorporation of Ca2+ ions into the crystalline structure of ZnO. The quantity of spherical NCs was observed to increase; however, the average size remained approximately 50 nm. The EDS results revealed only Zn and O atoms (Figure 2F). There were no Ca atoms in the results of EDS due to the low percentage of CaO formed in the sample, as demonstrated in the XRD results (Figure 1). The presence of C and Au atoms was related to the sample port and metallization, respectively. Formation of CaO was found to have occurred on the basis of variations in the proportion of Zn relative to O. For example, in the sample of ZnO, the ratio between Zn and O was 1:1, confirming the formation of pure ZnO, since 1 Zn2+ ion is required for 1 O2−. In the doped samples, there was a relative increase in the percentage of O, indicating the formation of some compound containing O, which was CaO NCs based on the results of XRD.
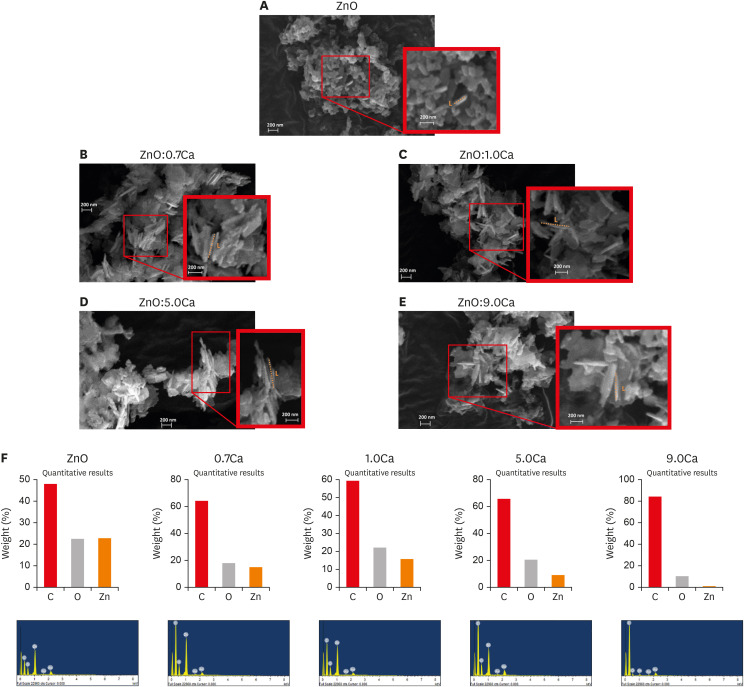
Scanning electron microscopy and energy dispersive X-ray spectrometry (EDS) results of the zinc oxide (ZnO):calcium (xCa) nanocrystals. ZnO nanocrystals (A) with spherical morphology predominated. In the rod-shaped nanocrystals, the rod length grew with the incorporation of Ca (B-E). In EDS, only Zn and O atoms were observed (F).
The photocatalytic activity and percentage discoloration of these samples were examined through MB degradation in aqueous solution at 25°C using UV-Vis light irradiation, as shown in Figure 3. After UV-Vis irradiation for 5 hours, the MB degradation was found to be 59%, 61%, 37%, 29%, and 37% in samples of pure ZnO and ZnO with 0.7, 1.0, 5.0 and 9 wt.% Ca, respectively.
Biological assays
1. SAOS-2 cytotoxicity
The cytotoxicity of NCs on SAOS-2 based on the MTT formazan assay is shown in Figure 4. At 10 µg/mL, ZnO, ZnO:0.7Ca and ZnO:1.0Ca had the highest percentages of cell viability (p < 0.05) (Figure 4A). At 50 µg/mL, ZnO:1.0Ca demonstrated higher viability than all the experimental groups (p < 0.05) (Figure 4B). At 100 µg/mL, ZnO:0.7Ca and ZnO:1.0Ca presented higher values of cell viability than ZnO:5.0Ca and ZnO:9.0Ca (p < 0.05) (Figure 4C). Compared with the control group, ZnO:5.0Ca and ZnO:9.0Ca had a lower percentage of cell viability at 10 µg/mL (p < 0.05) (Figure 4A). All groups presented a lower percentage of viability at 50 µg/mL (Figure 4B) and 100 µg/mL (Figure 4C) than the control group (p < 0.05), except ZnO:1.0Ca at 50 µg/mL, which showed a similar value (p > 0.05).
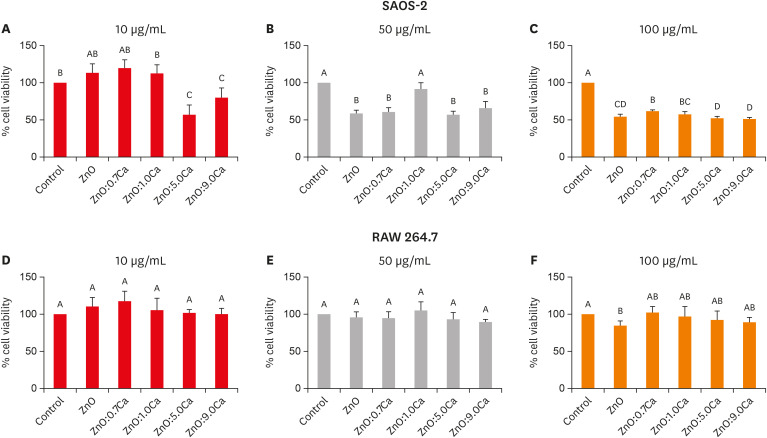
Cell viability determination of SAOS-2 and RAW 264.7 after treatment with zinc oxide (ZnO), ZnO:0.7 calcium (Ca), ZnO:1.0Ca, ZnO:5.0Ca and ZnO:9.0Ca by the MTT formazan assay. (A-C) The effects of nanoparticles at the concentrations of 10 µg/mL, 50 µg/mL, and 100 µg/mL, respectively, on SAOS-2 viability. (D-F) The effects of nanoparticles at the concentrations of 10 µg/mL, 50 µg/mL, and 100 µg/mL, respectively, on RAW 264.7 viability. Capital letters allow comparisons among different nanocrystals and with the control group (Dulbecco's Modified Eagle's Medium).
2. RAW 264.7 cytotoxicity
The cytotoxicity of NCs on RAW 264.7 cells by the MTT formazan assay is shown in Figure 4. All groups evaluated had similar viability percentages among themselves (p > 0.05) and compared with the control (p > 0.05), regardless of the concentration evaluated (Figure 4D-F), except for the ZnO group at 100 µg/mL (Figure 4F), which presented lower cell viability than the control (p > 0.05).
3. hDPC cytotoxicity
The cytotoxicity of NCs on hDPCs based on the MTT formazan assay is shown in Figure 5. In the absence (−LPS) and presence of LPS (+LPS), all the groups presented lower viability levels than that of the control (p < 0.05). All the groups evaluated had similar viability percentages among themselves (p > 0.05).
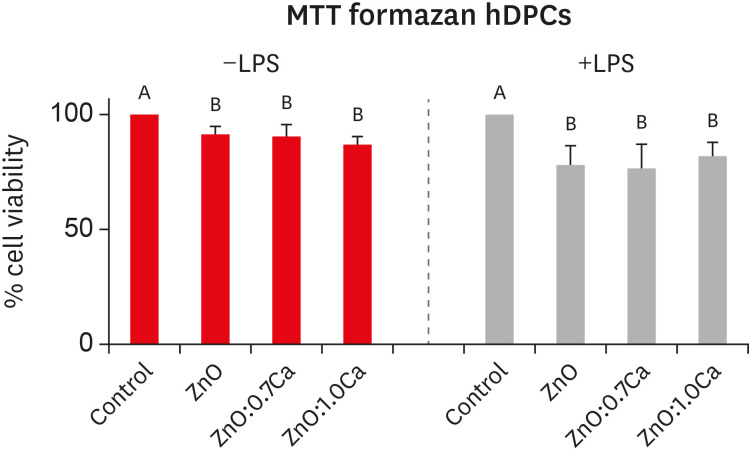
Cell viability determination of human dental pulp cells (hDPCs) after treatment with zinc oxide (ZnO), ZnO:0.7 calcium (Ca) and ZnO:1.0Ca by the MTT formazan assay. Effects of nanocrystals at the concentrations of 10 µg/mL on lipopolysaccharide-nonstimulated (−LPS) and -stimulated (+LPS) hDPCs. Capital letters allow comparisons among different nanocrystals for the same condition (−LPS or +LPS) and with control groups (positive control group: +LPS; and negative control group: Dulbecco's Modified Eagle's Medium, −LPS).
4. Quantification of NO production
Figure 6 presents the amount of NO produced by hDPCs after treatment with ZnO, ZnO:0.7Ca, and ZnO:1.0Ca NCs considering LPS stimulation (+LPS) or nonstimulation (−LPS). Both in the absence and presence of LPS stimulation, NO production by hDPCs treated with NCs did not show statistically significant differences from the negative control group (DMEM) (p > 0.05). All the groups presented lower values than the positive control group (+LPS) (p < 0.05).
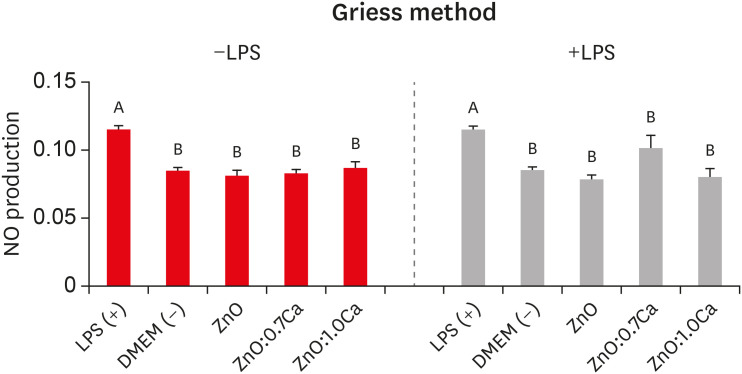
Nitric oxide (NO) production by lipopolysaccharide-nonstimulated (−LPS) and -stimulated (+LPS) human dental pulp cells (hDPCs) after treatment with zinc oxide (ZnO), ZnO:0.7 calcium (Ca), and ZnO:1.0Ca. The effects of nanocrystals at the concentration of 10 µg/mL on NO production in −LPS and +LPS hDPCs. Capital letters allow comparisons among different nanocrystals for the same condition (−LPS or +LPS) and with control groups (positive control group: +LPS; and negative control group: Dulbecco's Modified Eagle's Medium [DMEM], −LPS).
5. ROS production
Figure 7 presents the amounts of ROS produced by hDPCs after treatment with ZnO, ZnO:0.7Ca and ZnO:1.0Ca NCs considering LPS stimulation (+LPS) or nonstimulation (−LPS). In cells without LPS stimulation, ZnO:1.0Ca produced a higher amount of ROS than ZnO (p = 0.0281) and a similar amount to ZnO:0.7Ca (p > 0.05). In the presence of LPS, ZnO yielded similar amounts of ROS compared with ZnO:1.0Ca (p > 0.05) and higher percentages than ZnO:0.7Ca (p = 0.0065). All NCs induced the cells to produce higher amounts of ROS than was found in the negative control group (DMEM) (p > 0.05) and lower amounts than was found in the positive control group (LPS) (p < 0.0001).
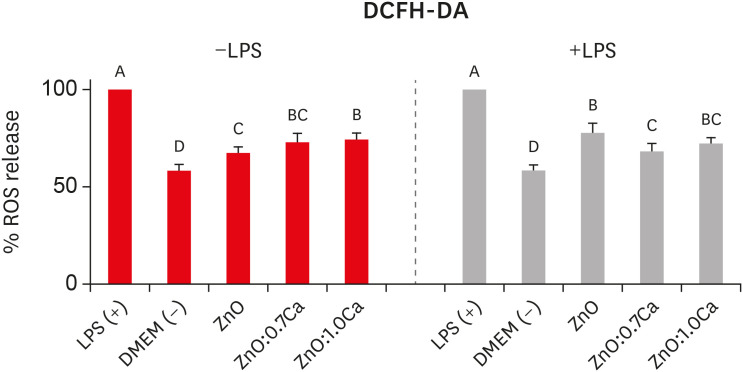
Reactive oxygen species (ROS) production by human dental pulp cells (hDPCs) after the treatment with zinc oxide (ZnO), ZnO:0.7 calcium (Ca), and ZnO:1.0Ca. The effects of nanocrystals at the concentration of 10 µg/mL on ROS production in lipopolysaccharide-nonstimulated (−LPS) and -stimulated (+LPS) hDPCs. Capital letters allow comparisons among different nanocrystals for the same condition (−LPS or +LPS) and with control groups (positive control group: +LPS; and negative control group: Dulbecco's Modified Eagle's Medium [DMEM], −LPS).
DCFH-DA, 2′,7′-dichlorodihydrofluorescein diacetate.
According to the images generated by the application of the DCFH-DA probe, the exposure of hDPCs to LPS without NCs resulted in significantly higher ROS production than was found in the untreated group without LPS stimulation (Figure 8). In general, NC treatment of hDPCs stimulated with LPS (Figure 8 column on the right), irrespective of the NP used, appeared to reduce ROS production in comparison to groups that were stimulated and not treated with NCs. For hDPCs that did not come into contact with LPS (Figure 8, column on the left), all the treatments with NCs were capable of increasing the quantity of ROS produced by the cells.
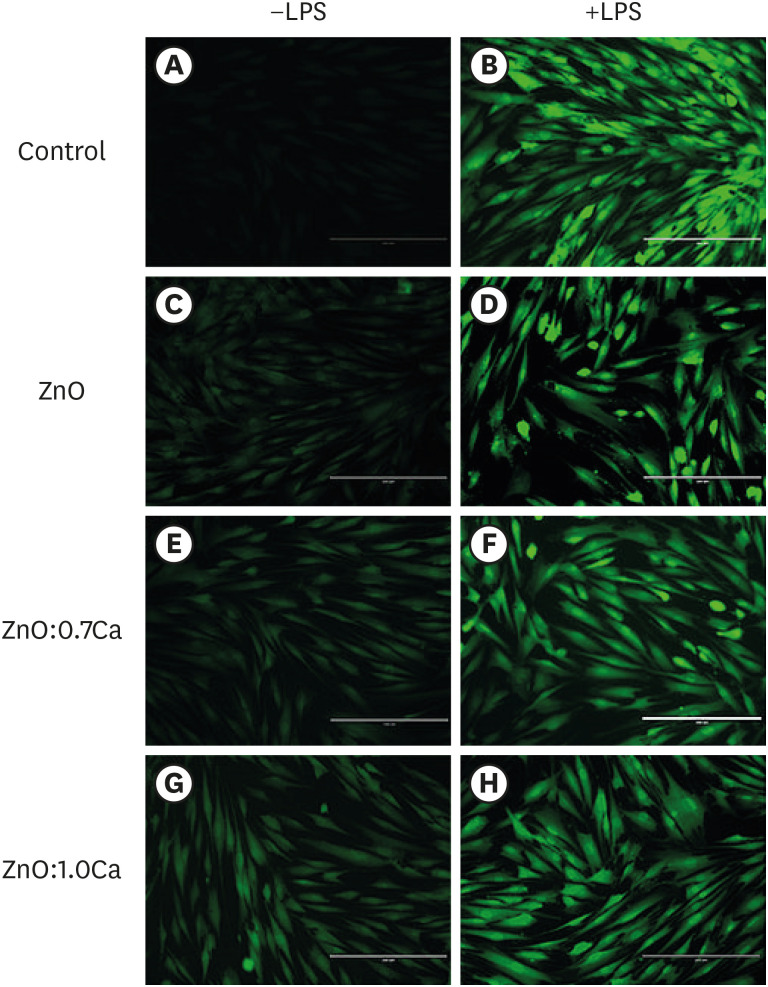
Images representative of reactive oxygen species (ROS) production by human dental pulp cells (hDPCs) treated with zinc oxide (ZnO), ZnO:0.7 calcium (Ca) and ZnO:1.0Ca. Images in the column on the left represent the groups in which the cells were notstimulated by lipopolysaccharide (−LPS), while in the images in the column on the right, the cells were kept in contact with LPS (+LPS). Dulbecco's Modified Eagle's Medium (DMEM) (A), LPS (B), ZnO (C, D), ZnO:0.7Ca (E, F), ZnO:1.0Ca (G, H). The intensity of fluorescence emitted by the 2′,7′-dichlorodihydrofluorescein diacetate (DCFH-DA) probe quantified ROS production, with higher fluorescence indicating higher levels of production of these oxidant agents.
DISCUSSION
The results of the physical characterizations confirmed that ZnO NCs were synthesized and that increased Ca doping concentrations led to the formation of nanocomposite Ca-doped ZnO with CaO NCs. The changes in crystal lattices in terms of the type and percentage of the synthesized materials were evaluated using XRD, which is often used to characterize new materials. To complement the XRD results, SEM images with EDS provided information on the microstructural and topographic features of the samples, in addition to a chemical analysis of the materials with qualitative and quantitative information. The SEM images confirmed that ZnO NCs with a spherical morphology predominated, with small amounts exhibiting a rod shape. The increase in doping concentration favored an increase in rod length, while NCs with spherical morphologies remained the same size. All the results confirmed the incorporation of Ca2+ ions into the crystalline structure of ZnO and the formation of CaO in samples doped with Ca. Thus, in this work, a nanocomposite of Ca-doped ZnO and CaO NCs was formed.
Treatment with the evaluated NCs did not affect cell viability at lower concentrations, but at concentrations of 50 µg/mL and 100 µg/mL, the viability was reduced. Studies have demonstrated different toxic effects associated with nanomaterials, including mitochondrial damage [19]. The MTT formazan assay is based on the conversion of yellow tetrazolium salt into dark blue formazan crystals by mitochondrial dehydrogenase activity [20]. However, it is important to note that nanomaterials containing reactive minerals forming antioxidants may interfere with the MTT assay, requiring additional methodologies to complement the results. The cell models selected for the first stage of this study were RAW 264.7 macrophage and SAOS-2 osteoblast cell lines. The choice of permanent cell lines or primary cell cultures as study models is controversial [21]. Although primary culture cells are obtained directly from the organism and therefore exhibit more faithful behavior [21], the use of immortalized cell cultures in a preliminary study assessing new materials is recommended in the literature [2223], and such cultures provide useful complementary systems for studying normal cells.
In this way, after determining the most cytotoxic concentrations by assessing the viability of immortalized cultures, which served as an initial screening, we opted for the less cytotoxic concentrations for tests in primary hDPC cultures, as these cells are more sensitive. In general, the results of the cell viability tests indicated that the less cytotoxic NCs were ZnO, ZnO:0.7Ca, and ZnO:1.0Ca at 10 µg/mL, while cells treated with NCs containing the highest percentage of calcium in their composition (5.0% Ca and 9.0% Ca) showed the lowest cell viability values. This result demonstrates that higher concentrations of CaO favored the cytotoxicity of the nanocomposite. Calcium ion (Ca2+) plays multiple important roles in cellular functions, acting as a secondary messenger that controls cellular responses and mediates physiological pathways, including cell death pathways [24]. The scientific literature states that when the mechanism of homeostasis of Ca2+ signaling is disturbed, cells can die via apoptosis or necrosis [25]. An overload of extracellular Ca2+ may increase its intracellular concentration, but the cell response can differ depending on whether the calcium signal develops as a local or a global change [24].
Another mechanism related to the cytotoxicity of cells treated with 5.0% Ca and 9.0% Ca is the high percentage of doping of these NCs. The increase in doping percentage alters the physical properties of NCs, such as their size, as demonstrated in the SEM images. These properties can lead to a greater internalization of the doped NCs inside the cell and interactions with proteins and biomolecules related to the production of ROS and cellular apoptosis [23], increasing the cytotoxicity, as observed in the present study. The large amounts of ROS are mainly attributed to the larger surface area, an increase in oxygen vacancies, and the diffusion ability of the reactant molecules [17]. Oxygen vacancies can act as electron capturing centers, which prevent the combination of photogenerated electrons (e− CB) and holes (h+ VB) and promote photocatalytic ability [26]. Ca was proposed to enter the B site of BaTaO2N, (i.e., BaCax/3Ta1-x/3O2+yN1-y; 0 ≤ x, y ≤ 1) and to successfully gain control over its defective levels (e.g., Ta4+ species) and band gap to improve photocatalysis [22]. Another study reported that the excellent degradation dye activities of Ca(II)-doped In2S3 were mainly attributed to the large amount of effective reactive species such as h+ and O2− [27].
Oxygen vacancies acted as active centers and were the main cause of the difference in photocatalytic activities for Mg, Ca and Y-doped ZnO/La2O3 samples of varying morphologies [28]. Thus, based on the literature, the Ca sample of 0.7 wt.% was determined to have the highest photocatalytic activity. The introduction of higher levels of Ca (more than 0.7 wt.% Ca) had negative effects on both photocatalytic activity and stability, probably due to the rapid decrement of visible light absorbance and the increment of the level of defects [22]. Excess defects can act as recombination centers for electron and hole pairs. Radical oxidative species, such as OH− and O2−, generated on the surface of catalysts are responsible for the degradation of MB. The 0.7 wt.% Ca sample showed an MB degradation of 61%, which was greater than that of ZnO (59%), indicating that synergistic effects between NCs might intensify the photocatalytic activity. The diminution of MB degradation in the 1.0%, 5.0%, and 9.0% Ca samples (37%, 29%, and 35%, respectively) occurred because the percentage of CaO was higher than in the other samples that disfavored photocatalysis.
hDPCs were chosen for the second experimental stage in order to test the least cytotoxic doping concentrations in a heterogeneous cell model that represented the site where the material is intended to be used. These cells can be obtained from dental pulp explants or by digestion of dental pulp tissue from exfoliated deciduous or permanent teeth [29]. For this study, pulp cells were isolated from primary teeth because it has been suggested that these cells show a better response than those from permanent teeth [30]. In addition, the nanomaterial tested has potential use in pulpotomies. Taking into account that most pulpotomies in deciduous teeth occur due to caries, it was crucial to simulate the inflammatory environment using LPS. Therefore, the ZnO, ZnO:0.7Ca, and ZnO:1.0Ca groups were placed in contact with stimulated and nonstimulated pulp cells.
LPS is an endotoxin that makes up the cell wall of Gram-negative bacteria and is capable of stimulating the production of several inflammatory mediators. It is therefore involved in the development of pulp inflammation. In this study, we chose to use E. coli LPS based on Montoro et al. [18]. The concentration of 50 µg/mL was chosen based on the findings of a previous pilot experiment regarding cell proliferation and the production of ROS. Although the concentration was higher than that found in the current literature, the determination of LPS concentrations in studies involving biomaterials must be defined individually in order to guarantee its effectiveness in inducing cell stress. LPS can stimulate the production of many cytokines in hDPCs, including the well-known inflammatory mediators IL-1B and IL-6 [3132]. Furthermore, LPS-induced cellular stress results in increased ROS [1833] and NO production [1834], as demonstrated in this study. Therefore, NO and ROS have been used as nonspecific markers of in vitro induction of inflammation [35]. Regarding both mediators, the treatment with LPS was considered as the positive control because it would tend to increase their production, whereas the nonstimulated cells had extremely low or undetectable values of ROS and NO.
NO is a cytotoxic, short-lived, reactive radical that is released in response to inflammatory cytokines and agents by a process involving NO synthase (NOS) [34]. Specifically, inducible NOS (iNOS) is activated by microbial products such as LPS [34]. Thus, hDPC cells that were not stimulated with LPS would not show an increase in NO production unless the tested NCs were capable of promoting a cytotoxic effect, which was confirmed by the present results. In the cells stimulated with LPS and treated with NCs, the NO levels were again not elevated, which demonstrated that all NCs were able to reduce NO production. These results are probably related to the observation that iNOS production involves a calcium-independent mechanism; that is, the binding of calmodulin to iNOS is tight even at low Ca2+ concentrations [34]. Therefore, the results were not related to the percentage of calcium present in the NCs.
Recent studies have shown that various NCs may be able to stimulate the production of ROS [82336], which was confirmed by the present findings in which all the tested NCs induced increased ROS production in the nonstimulated hDPCs, a finding that was most notable for ZnO:1.0Ca. In contrast, in the LPS-stimulated cells, treatment with NCs reduced ROS production, indicating that these NCs had the potential to inhibit the exacerbated response caused by the LPS stimulus, as the ZnO group presented lower values. These results are consistent with the fluorescence DCFH-DA probe images, which showed higher fluorescence in all groups treated with the NCs than in those without LPS treatment, as well as lower fluorescence intensity than the group without treatment and LPS stimulation. Moreover, a subtle increase in fluorescence intensity of the ZnO:1.0Ca group was detected in the cells without LPS and in the ZnO group in the cells with LPS. These results are in agreement with previous studies showing an increase in ROS levels after exposure to ZnO NCs at different concentrations, including 10 μg/mL [3738]. Nevertheless, in these studies, hDPCs were not evaluated, and only the effects of the materials on cells without induced inflammation were observed.
The overall increase in ROS production might be related to the cytotoxicity of ZnO NCs. Two factors determine the cytotoxicity of ZnO NCs: (i) release of zinc ions (Zn2+), and (ii) increased ROS production [39]. There is a proven relationship between oxidative stress, calcium homeostasis, and cell viability [40]. A previous study verified an inverse correlation between the intracellular level of Ca2+ and cellular viability (R2 = 0.976), and between ROS and cell viability (R2 = 0.952) [40]. The results of the present study support an inverse relationship between ROS and cell viability because all the groups treated with NCs presented lower viability than the untreated group, and the cell viability in the ZnO:1.0Ca group in non-LPS-stimulated hDPCs and ZnO in stimulated cells was similar or lower to that observed in the negative controls.
Despite the limitations of the present research, it is important to emphasize that the NCs used in this study have not been evaluated previously. Therefore, this is an important preliminary study to define the specific physical characteristics of these NCs and the biological behavior of the cellular models used with these materials. However, more studies should be performed using another model of cell culture and molecular analyses to complement the present findings. In addition, the association of vehicles that provide adequate consistency and plasticity to the NC, allowing its insertion on the pulp, will be of fundamental importance in future studies.
CONCLUSIONS
Based on this data, we conclude that the NCs were successfully synthesized. The NCs tested at low concentrations were not cytotoxic to hDPCs. ZnO, ZnO:0.7Ca, and ZnO:1.0Ca maintained NO production at basal levels, while ROS production was increased compared to the DMEM group. In LPS-stimulated cells, all NCs reduced the levels of ROS production compared with the LPS group, with better results for ZnO:0.7Ca. Therefore, synthesizing these results, ZnO:0.7Ca is appropriate for future studies evaluating pulp protection materials.
ACKNOWLEDGMENTS
This project was developed at CPBio - Biomechanics, Biomaterials and Cell Biology Research Center, Multiuser Laboratory of the Institute of Chemistry and Faculty of Chemical Engineering, both of the Federal University of Uberlândia.
Notes
Funding: The research was financed in part by the Coordenação de Aperfeiçoamento de Pessoal de Nível Superior - Brasil (CAPES) - Finance Code 001, FAPEMIG and CNPq.
Conflict of Interest: No potential conflict of interest relevant to this article was reported.
Author Contributions:
Conceptualization: Souza GL, Moura CCG, Turrioni AP.
Data curation: Souza GL, Silva ACA, Marinho JZ.
Formal analysis: Souza GL, Dantas NO, Silva ACA, Moura CCG, Turrioni AP.
Funding acquisition: Turrioni AP, Moura CCG, Silva ACA, Dantas NO.
Investigation: Souza GL, Marinho JZ, Silva TR, Bonvicini JFS.
Methodology: Souza GL, Marinho JZ, Silva TR, Bonvicini JFS.
Project administration: Moura CCG.
Resources: Moura CCG, Silva ACA, Dantas NO, Turrioni AP.
Software: Souza GL, Silva ACA, Marinho JZ, Silva TR, Bonvicini JFS.
Supervision: Moura CCG.
Validation: Souza GL, Moura CCG, Turrioni AP.
Visualization: Souza GL, Moura CCG, Turrioni AP.
Writing - original draft: Souza GL, Moura CCG, Silva ACA, Marinho JZ, Silva TR, Dantas NO, Bonvicini JFS, Turrioni AP.
Writing - review & editing: Souza GL, Moura CCG.

